Quantcast
Channel: Zero Hedge - Managing Money
Viewing all 57 articles
Browse latest View live

A Bubble in Dumb Money

$
0
0

By Chris at www.CapitalistExploits.at

Market dislocations occur when financial markets, operating under stressful conditions, experience large widespread asset mispricing.

Welcome to this week's edition of “World Out Of Whack” where every Wednesday we take time out of our day to laugh, poke fun at and present to you absurdity in global financial markets in all its glorious insanity.

kramer

While we enjoy a good laugh, the truth is that the first step to protecting ourselves from losses is to protect ourselves from ignorance. Think of the "World Out Of Whack" as your double thick armour plated side impact protection system in a financial world littered with drunk drivers.

Selfishly we also know that the biggest (and often the fastest) returns come from asymmetric market moves. But, in order to identify these moves we must first identify where they live.

Occasionally we find opportunities where we can buy (or sell) assets for mere cents on the dollar - because, after all, we are capitalists.

In this week's edition of the WOW we're covering the death of active investing (or not)

Scan the financial news today and amongst the rubble 3 things stand out.

  1. US politics is now officially at the top of the fruit-bowl after entering banana republic territory.
  2. Sadly what happens to Kim Kardashian, who as far as I can tell is famous for being famous, is more important than wealth inequality, the demographic timebomb, unfunded pensions, and (amazingly) the headache I got after seeing her on Bloomberg. Yes, really.
  3. Active investing will blow away in the winds of history, replaced by passive strategies. Yup, it's over, folks. Thanks for playing.

It is the 3rd point that we lend our eye to here today.

But first let me state my bias up front. It's important for you to know so you can critique objectively - something we should all do.

Many many of my friends and colleagues manage money (some of them godawful amounts of the stuff), and many of them have been facing redemptions over the past few years with this year 2016 being the worst yet.

The WSJ recently ran an article about the dying business of picking stocks:

The Dying Business Of Picking Stocks

A few months ago Perry Capital closed its doors after losing over half of its capital to redemptions. As reported by Bloomberg:

"The closure is the latest -- and almost certainly not the last -- in what is shaping up to be the biggest shakeout in the $2.9 trillion hedge fund industry since the financial crisis.

London-based Nevsky Capital closed its doors, citing fewer money-making opportunities because of the emergence of computer-driven strategies and index funds. Tudor Investment Corp. dismissed about 15 percent of its workforce in a shakeup in August. And Brevan Howard Asset Management plans to stop charging existing clients management fees on any new investments they make in two of its hedge funds, according to a person with knowledge of the matter."

In yet another Bloomberg article:

"About 530 funds were liquidated in the first half, on pace for the most shutdowns since 2008."

Bruce Berkowitz, one of the most successful managers in his field and the CIO of Fairholme Capital, is down from $20 billion to $2 billion in a decade! Across the spectrum actively managed mutual funds are down a stunning 79% from 10 years ago.

What's Happening?

Where has the money moved to? One word: passive.

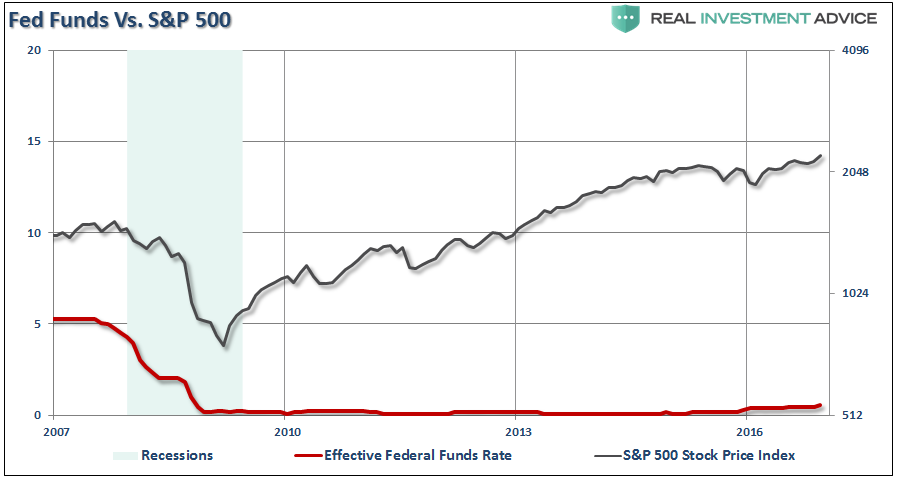
Index funds have much lower fees than active funds and so I can see the appeal. And besides, hedge funds as a group haven't outperformed the US stock market since 2008.

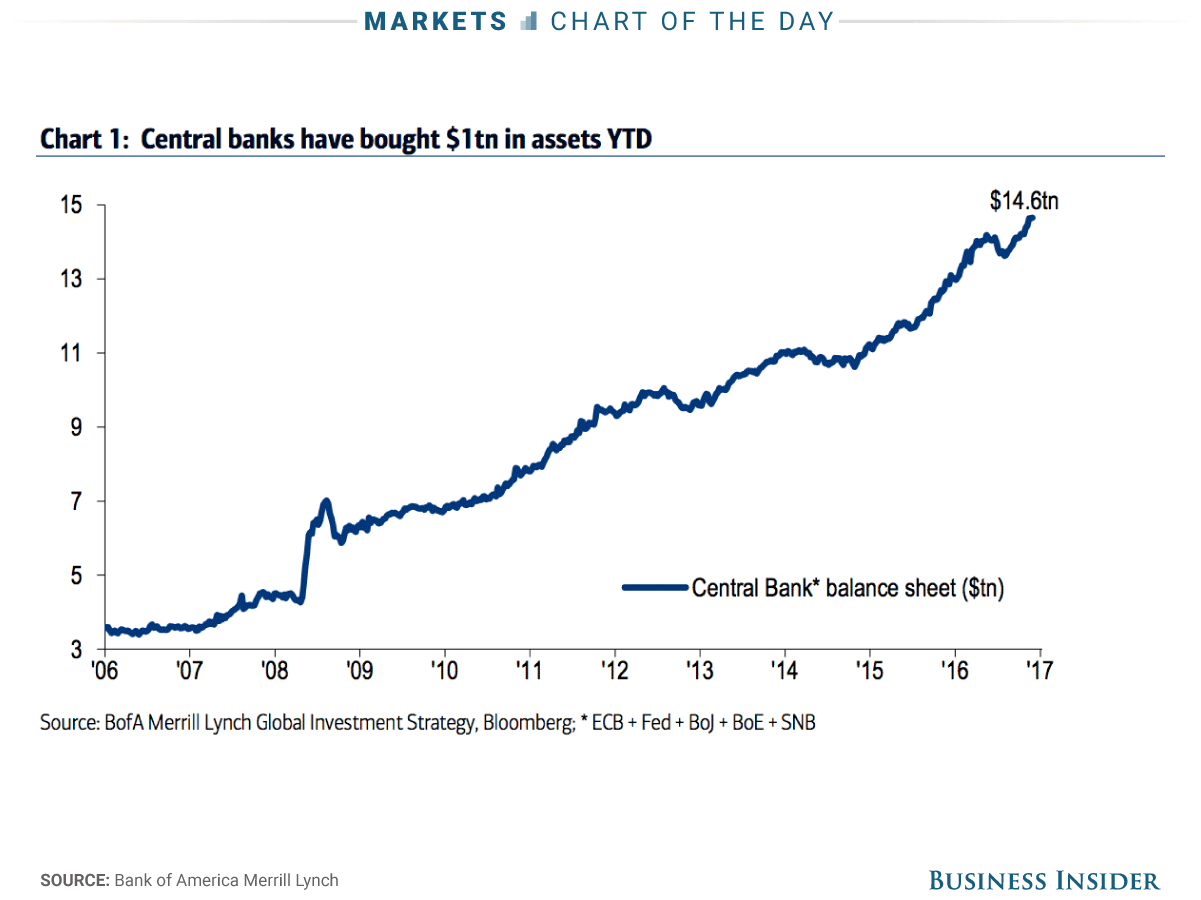
The thing is since 2008 the Fed and global central banks have owned the market. It's no wonder that some of the most talented money managers on this ball of dirt have underperformed the market.

--------------------------------------

Kyle Bass Gold

--------------------------------------

The question is, is the market right?

Well, the market is always the final arbiter and we have to acknowledge this but in a word, no!

There are two main reasons for that:

Reason 1

Return is only one part of the equation. Risk is its ever present bedfellow. A bedfellow that precious few retail investors understand until they receive a punch to the gut.

Asset managers have a duty to protect capital. This means avoiding risk. So what if an index ETF is beating a fund? How many investors are asking the question why? Clearly not many.

Let me ask you a question. What was widely considered the most stable consistent and safe asset class in 2006?

iShares US Real Estate ETF

You're looking at the iShares US Real Estate ETF (IYR). It was THE worst place to be in the coming years.

From a high of 92.5 to 22.21 in a little over 12 months it provided passive index investors what is commonly referred to as a wipeout. But you can't get angry at it. It's just a dumb index doing what it's meant to do.

Now I'm trying to think of just one of my friends or colleagues who was long US real estate in 2006 and 2007 and I can't think of one. Most, including myself, never profited from the collapse but then again we didn't get wiped out either. Did my hedge fund buddies get ridiculed in 2006 for not being long real estate? Of course. But if something doesn't make any sense it pays to stay away.

If you've got a good money manager (and there are some awesome ones out there), then you're paying them for risk adjusted returns.

Reason 2:

Money managers face a tough choice (and it's a choice you as a private investor don't have to worry about): they have to report their quarterly numbers. And if those numbers don't beat the benchmark, they face redemptions.

In today's fast moving world investors' time horizons have narrowed. Like 10-year old Johnny Snot Nose, yet to develop the skills of patience, they want results and they want them now.

This dynamic has forced many money managers to take risks which they really shouldn't be taking, stepping further down the risk curve in order to at least match the benchmark. It's understandable but also daft.

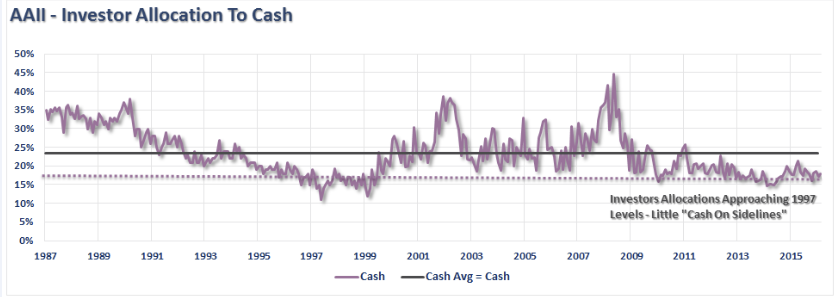
What do you do when the overall indexes are beating you but you see the inherent dangers in the market and refuse to participate, preferring to protect your capital, going to cash, and avoiding overpriced assets?

Well, now we're finding out as investors shun even the best active money managers in favour of "passive investing".

A Bubble Forming

I recently had a conversation with a part-time investor who is managing his money and trying to do it himself. He was buying ETFs because of the low fees, and since they provide him exposure to pretty much any asset class he felt they made sense. All good, except it was a mess when we began to dig deeper.

He'd been buying leveraged ETFs, specifically NUGT which is the 3x leveraged gold shares ETF. I warned about these last week when suggesting to never invest in these horrible things. He bought a healthy chunk in May of 2016 and since GDX (the gold miners index) is essentially flat from the time of his purchase he couldn't understand why he had lost money.

The second thing he'd been doing was he'd bought a half dozen bond ETFs for "safety". When we discussed it he felt that because he owned the big five he was diversified. Now buying sovereign bonds at the tail end of the debt super cycle impresses me as insane and you're not even compensated for the risk!

The other thing he'd been doing, as a hedge against potential market volatility, was to buy a couple of low volatility ETFs. Oy vey!

In short, his portfolio was sporting so much risk it made my head spin.

In the last 5 years over $50 billion has flowed into low volatility ETFs, distorting the stocks they comprise.

Mark Yusko, the founder and CIO of Morgan Creek Capital recently exposed the insanity of what's going on here (and it's also something Chris Mayer and I discussed recently in a podcast).

The assets which are included in many of the ETFs have been heavily skewed by dumb money coming in. Yusko pointed out Exxon Mobil (XOM) which historically has a P/E of 12 but now trades at 35x earnings. Why? Because it's part of an ETF that is on the flip side of all those liquidating hedge funds. Dumb money.

Spectacular!

I can't wait to see this one play itself out. It's going to be more fun than watching Trump and Hillary in a cage fight, which I dare say would be the highest grossing reality TV in history and the one and only reality TV show I'd actually watch.

What Next?

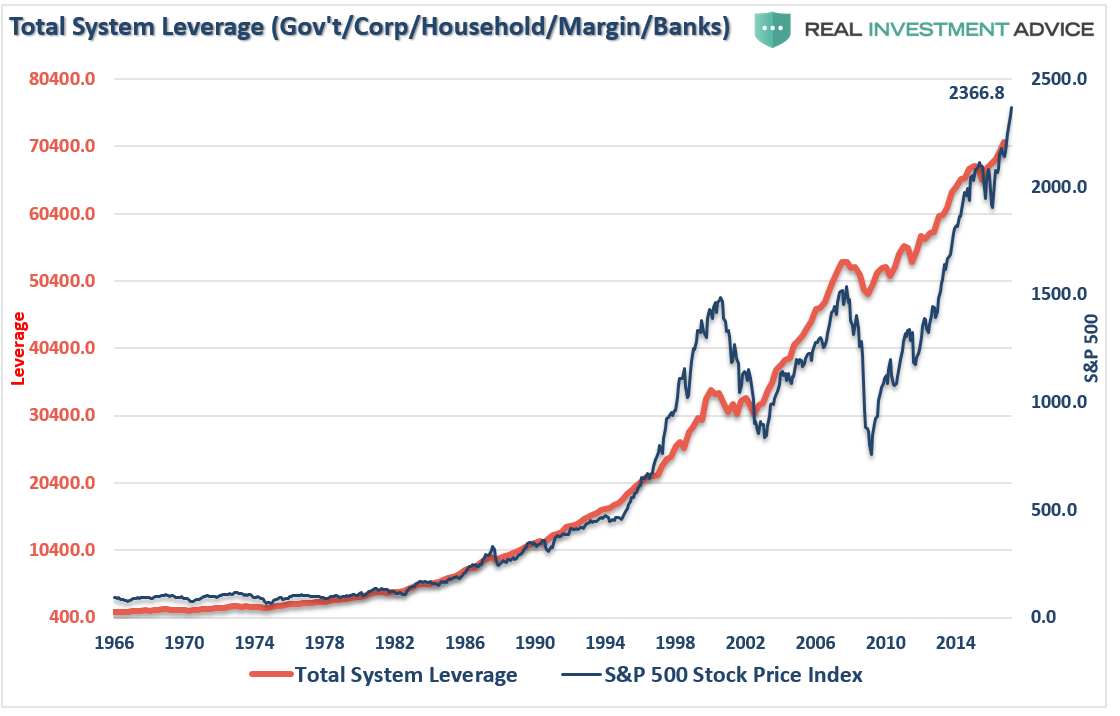
Less money men is a good thing. And though many (like those mentioned above) are being thrown out with the bathwater, I don't see this as being much more than yet another consequence of an extended period of gross mispricing of assets by our monetary overlords.

Howard Marks famously said that the cure for high prices is high prices, and the cure for low prices is low prices.

The hedge fund industry has over the years attracted billions of capital and whenever money flows into a sector we bipeds follow it. Many of those who came to managing money probably should never have been doing so but instead gone into growing marijuana, or making Yorkshire puddings, or farming chickens. Whatever, they shouldn't have been managing money. Now many of them are going to do just that. I look forward to a bubble in Yorkshire puddings.

Passive money is a ludicrous concept. Money is not passive. Your attitude to it may be but it is and always will be dynamic. And so sticking money blindly into index funds and ETFs is almost as daft as it is giving it to your government. Almost!

John Hussman, CIO of Hussman Funds put it succinctly:

"Passive returns look glorious in the rear-view mirror precisely because Fed-induced yield-seeking speculation has driven nearly every asset class to rich or obscene valuations in recent years.


But investors should understand that risky securities do not, over time, persist without risk premiums. Indeed, neither aggressive Fed easing nor low interest rates has historically supported stocks during periods when, for whatever reason, investor preferences shift toward risk-aversion.


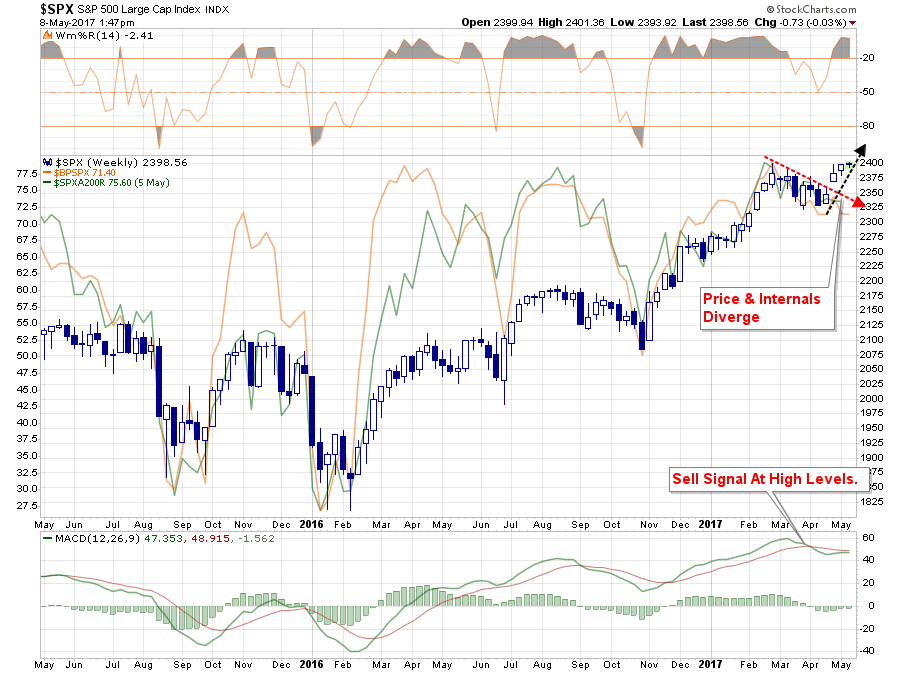
This lesson should have been drawn from the 2000-2002 and 2007-2009 collapses. The same lesson is likely to be taught again shortly, as we infer increasing risk-aversion among investors based on deteriorating uniformity and increasing dispersion across market internals. The immediacy of our concerns would ease in response to a material improvement in those internals."

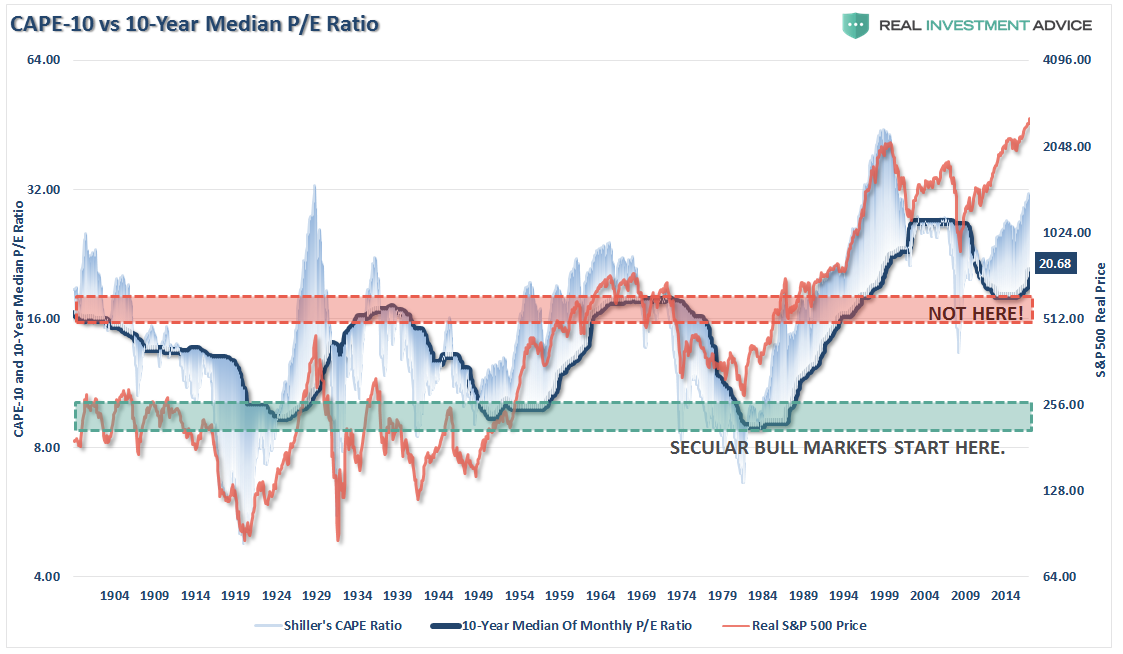
I fear we're about to find out how smart "smart beta" really is. When the inevitable happens and Bob and Mabel, together with their millennial grandkids, Peach and Cloud, lose their shirts there'll be no-one there to explain to them, "sorry, snowflake but did you realise that over half of the index you bought was sporting P/E and P/B ratios that have only existed a couple of times before?"

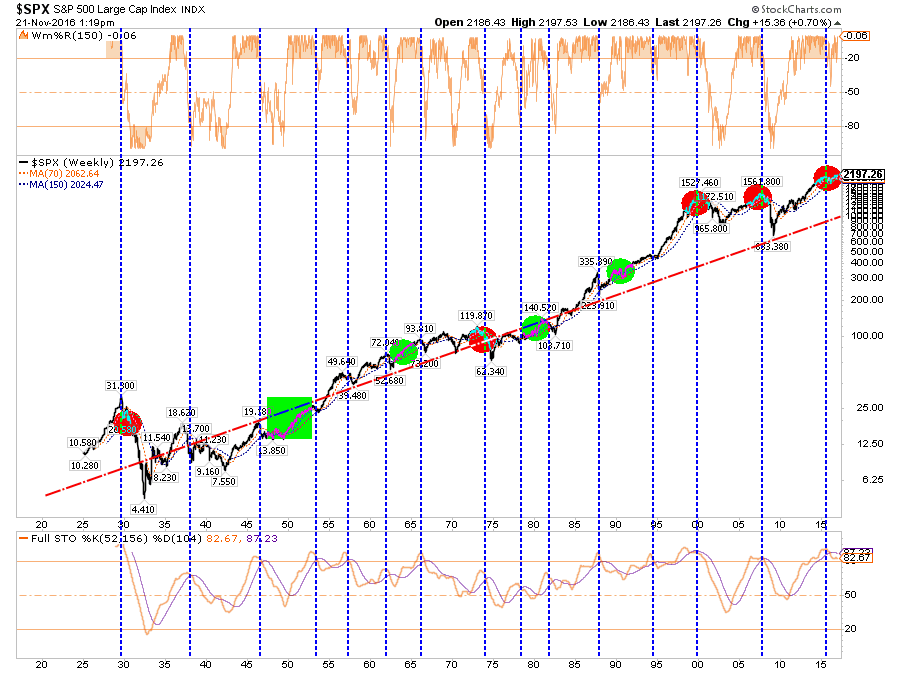
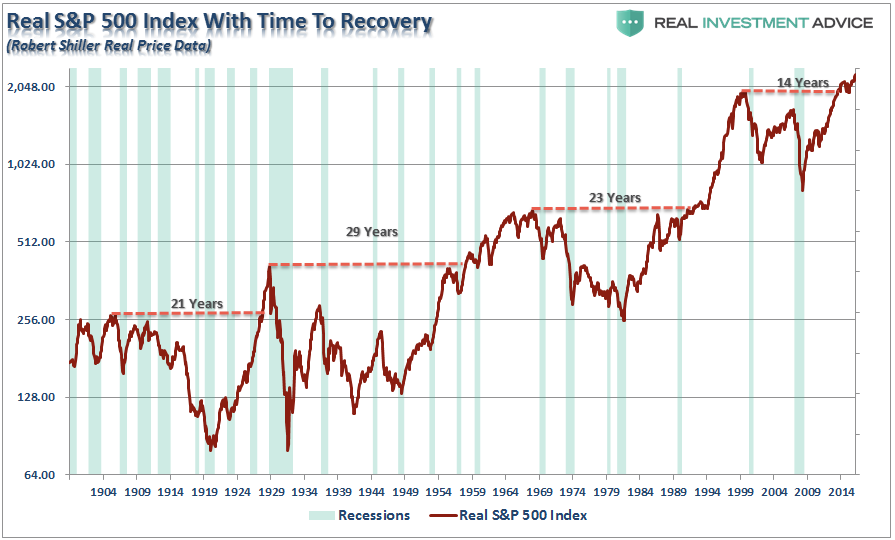
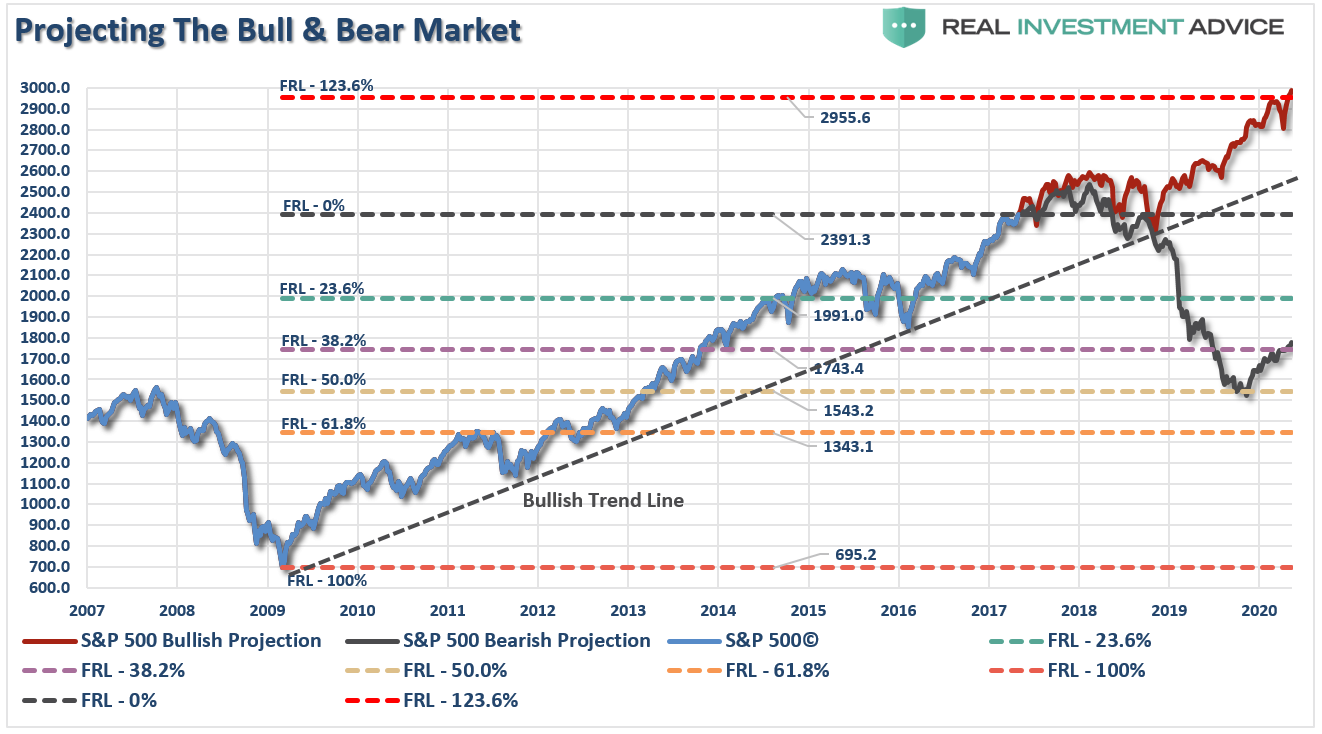
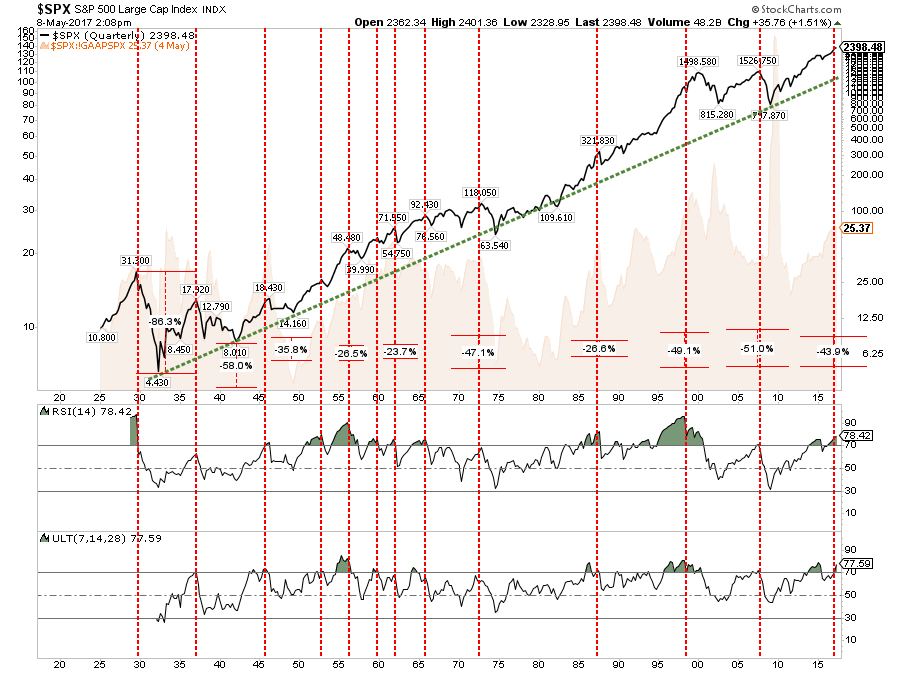
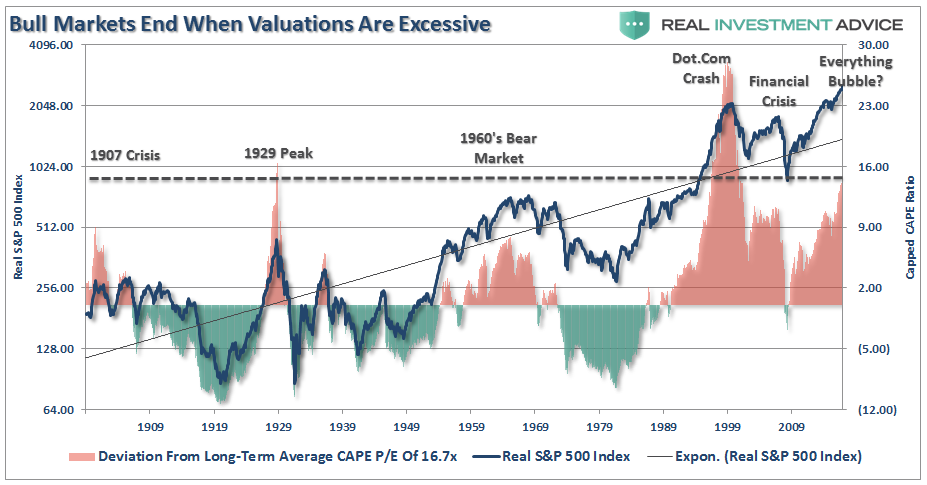
Remember, the 1929 crash took 30 years on an inflation adjusted basis to get back to breakeven. Passively investing in indexes at what looks like the eve of a systemic market shift may well prove the value in active investing.

Question

Wow - Dumb Money

Cast your vote/leave your comment here and also see what others think

Know anyone that might enjoy this? Please share this with them.

Investing and protecting our capital in a world which is enjoying the most severe distortions of any period in mans recorded history means that a different approach is required. And traditional portfolio management fails miserably to accomplish this.

And so our goal here is simple: protecting the majority of our wealth from the inevitable consequences of absurdity, while finding the most asymmetric investment opportunities for our capital. Ironically, such opportunities are a result of the actions which have landed the world in such trouble to begin with.

- Chris

"An investment operation is one which, upon thorough analysis, promises safety of principal and an adequate return. Operations not meeting these requirements are speculative."— Benjamin Graham

--------------------------------------

Liked this article? Don't miss our future missives and podcasts, and

get access to free subscriber-only content here.

--------------------------------------


Weekend Reading: Stuck In The Middle - Again

$
0
0

Submitted by Lance Roberts via RealInvestmentAdvice.com,

I have written previously about being stuck in a trading range.

“Over the past couple of months, we have continued to drift from one economic report, or Central Bank meeting, to the next. Each report and meeting have continued to leave market participants confused as to what is going to happen next.


Is the economy improving? Or not?


Will the Fed hike rates? Not?


The bulls and the bears have met at the crossroad. However, neither is ready to commit capital towards their inherent convictions. So, for 43-days, and counting, we remain range bound waiting for what is going to happen next.”

Chart updated to present:

sp500-marketupdate-102716-2

The problem with going nowhere is that it makes managing money much more difficult. With the market having broken the bullish trend line from the February lows, as shown below, along with remaining overbought with a sell signal in place, the risk to the downside outweighs the potential for a further advance currently. With downtrend resistance from the previous highs pushing prices lower, the risk of a break below 2125 is elevated. Being a bit more cautious given the current technical backdrop will likely be prudent.

sp500-marketupdate-102816

While there are many simply suggesting just to buy into passive indexes and hold them, the brutal reality to such strategies have destroyed the ability for many to ever actually reach their investment goals.

However, despite the weight of evidence suggesting the markets are currently in a third bubble since the turn of the century, the commentary to ignore the outcomes related to such asset inflations is actually quite astonishing. Such is the result of a market seemingly immune to declines due to continued support, or at least belief thereof, from Central Banks.

But, just as was witnessed following “The Great Depression,” the bursting of the next asset bubble will likely once again drive participants away from the market for an entire generation, or longer. The problem for individual investors is the “trap” that is currently being laid between the appearance of strong market dynamics against the backdrop of weak economic and market fundamentals. Ignoring the last two to chase the former has historically not worked out well.

Alas, that is a story for another day, for now, we remain “stuck in the middle” waiting on an election outcome.

In the meantime, here is what I am reading this weekend.


Fed / Economy


Markets


Interesting Reads


“There are two hedges I know of; one is cash and the other is knowledge.” — Bruce Berkowitz

Weekend Reading: Markets Send A Warning

$
0
0

Submitted by Lance Roberts via RealInvestmentAdvice.com,

Over the past few months, I have repeatedly written about being stuck within an ongoing trading range and warned of the dangers of a downside break. From last week:

“The problem with going nowhere is that it makes managing money much more difficult. With the market having broken the bullish trend line from the February lows, as shown below, along with remaining overbought with a sell signal in place, the risk to the downside outweighs the potential for a further advance currently. With downtrend resistance from the previous highs pushing prices lower, the risk of a break below 2125 is elevated. Being a bit more cautious given the current technical backdrop will likely be prudent.”

sp500-marketupate-110216-3

Well, it didn’t take long as this past week the markets broke through that support and are now testing the 200-dma. With sell signals in place, the downside pressure currently remains as shown in the chart above by the vertical dashed black lines.

As I stated in yesterday’s post I expected a bounce on Thursday.

“Importantly, the violation of that crucial support suggests a further correction is likely. However, by the time a break is completed, the market has already become short-term oversold and a“sellable bounce” is very likely. As Bloomberg noted:


The index’s longest-ever run of losses was eight days, matched at the height of the financial crisis in October 2008. The S&P 500 started falling on Monday, September 29 and saw lower closes at the end of every trading day until October 10, in what was its worst week in history.”

With the markets now matching an eight-day decline as of Thursday’s close, there is an extremely high likelihood of a bounce, particularly next week following the election. In order for the markets to regain their bullish footing, and reverse some of the technical deterioration, an advance above 2150 would be required with an eventual breakout to new all-time highs.

Given the stronger dollar, weak economics, over-valuation, and rising rates, there is mounting evidence that we have seen the highs for this current market cycle. Therefore, it is advisable that rallies back towards 2125 are used to rebalance portfolios, raise higher levels of cash and reduce overall portfolio risk. After all, we can’t “buy low” if we didn’t “sell high” to begin with. 

In the meantime, here is what I am reading this weekend.


Fed / Economy


Markets


Interesting Reads


“Passive Investing Is The Path To Mediocrity” — Doug Kass

Welcome To The "Melt-Up"

$
0
0

Submitted by Lance Roberts via RealInvestmentAdvice.com,

In this past weekend’s newsletter, I discussed the potential for a breakout by the markets to“all time” highs during a holiday shortened, and light trading, week. On Monday, not to be disappointed, that expectation was met.

“The good news, as shown in the next chart, is the market was able to clear that downtrend resistance this week and turn the previous “sell signal” back up.  As suggested previously, it is not surprising the markets are pushing all-time highs as we saw on Friday.”

sp500-marketupdate112116-4

But what about after that?

“Importantly, with next week being a light trading week, it would not be surprising to see markets drift higher.


However, expect a decline during the first couple of weeks of December as mutual funds and hedge funds deal with distributions and redemptions. That draw down, as seen in early last December, ran right into the Fed rate hike that set up the sharp January decline.”

As I have noted above, there are many similarities in market action between the “post-Trexit” bounce, “Brexit” and last December’s Fed rate hike. I have highlighted there specific areas of note in the chart above.

“As with ‘Brexit’ this past June, the markets sold off heading into the vote assuming a vote to leave the Eurozone would be a catastrophe. However, as the vote became clear that Britain was voting to leave, global Central Banks leaped into action to push liquidity into the markets to remove the risk of a market meltdown. The same setup was seen as markets plunged on election night and once again liquidity was pushed into the markets to support asset prices forcing a short-squeeze higher.”

So, with that breakout, I am increasing equity risk exposure to portfolios. 

However, I am doing so with an offsetting hedge by adding exposure to interest rate sensitive sectors and beaten down opportunities. The reason for those hedges is due to the combined current backdrop of a sharply higher dollar and interest rates which have historically been the ingredients for rather nasty corrections.

The chart below is the 60-day moving average of total 60-day change of both interest rates and the dollar.  In other words, I have used a 60-day moving average to smooth out the volatility of the 60-day net change in the dollar and rates so a clearer trend could be revealed. I have then overlaid that moving average with the S&P 500 index.

dollar-rate-60day-change-112116

Not surprisingly, since stronger rates negatively impacts economic growth due to increased borrowing costs, and a stronger dollar reduces exports and ultimately corporate earnings, markets tend not to like the combination of two very much.

My analysis agrees with Dr. Lacy Hunt via Hoisington Investment Management who recently stated:

The recent rise in market interest rates will place downward pressure on the velocity of money (V) and also the rate of growth in the money supply (M). This is not a powerful effect, but it is a negative one. Some additional saving or less spending will occur, thus giving V a push downward. So, in effect, the markets have tightened monetary conditions without the Fed acting. If the Fed raises rates in December, this will place some additional downward pressure on both M and V, and hence on nominal GDP. Thus, the markets have reduced the timeliness and potential success of the coming tax reductions.


Another negative initial condition is that the dollar has risen this year, currently trading close to the 13-year high. The highly relevant Chinese yuan has slumped to a seven-year low. These events will force disinflationary, if not deflationary forces into the US economy. Corporate profits, which had already fallen back to 2011 levels, will be reduced due to several considerations. Pricing power will be reduced, domestic and international market share will be lost and profits of overseas subs will be reduced by currency conversion. Corporate profits on overseas operations will be reduced, but with demand weak and current profits under downward pressure, the repatriated earnings are likely to go into financial rather than physical investment.


Markets have a pronounced tendency to rush to judgment when policy changes occur. When the Obama stimulus of 2009 was announced, the presumption was that it would lead to an inflationary boom. Similarly, the unveiling of QE1 raised expectations of a runaway inflation. Yet, neither happened. The economics are not different now.Under present conditions, it is our judgment that the declining secular trend in Treasury bond yields remains intact.”

While not all combined increases led to major market events/crisis as noted above, more often than not equity participants tended not to fare exceptionally well.

That’s just reality.


Welcome To The “Melt-Up”

However, while economic and fundamental realities HAVE NOT changed since the election, markets are pricing in expected impacts of changes to fiscal policy expecting a massive boost to earnings from tax rate reductions and repatriated offshore cash to be used directly for stock buybacks.

To wit:

“We expect tax reform legislation under the Trump administration will encourage firms to repatriate $200 billion of overseas cash next year. A significant portion of returning funds will be directed to buybacks based on the pattern of the tax holiday in 2004.”– Goldman Sachs

share-buybacks-112116

But it is not just the repatriation but lower tax rates that will miraculously boost bottom line earnings. This time from Deutsche Bank:

Every 5pt cut in the US corporate tax rate from 35% boosts S&P EPS by $5. Assuming that the US adopts a new corporate tax rate between 20-30%, we expect S&P EPS of $130-140 in 2017 and $140-150 in 2018. We raise our 2017E S&P EPS to $130.”

See…buy stocks. Right?

Maybe not so fast. Here is the problem.

While you may boost bottom line earnings from tax cuts, the top line revenue cuts caused by higher interest rates, inflationary pressures, and a stronger dollar will exceed the benefits companies receive at the bottom line.

I am not discounting the rush by companies to buy back shares at the greatest clip in the last 20-years to offset the impact to earnings by the reduction in revenues. However, none of the actions above go to solving the two things currently plaguing the economy – real jobs and real wages. 

The rush by Wall Street to price in fiscal policy, which may or may not arrive in a timely manner, will likely push the markets higher in the short-term completing the final leg of the current bull market cycle. This was a point I addressed back in October on the potential for a rise to 2400 in the markets. With the breakout of the market to new highs, the bullish spirits have emboldened investors to rush into the most speculative areas of the market.

For now, it is all about the “Trump” trade. Which is interesting considering that just before the election we were all told how horrible a Trump election would be for the world economy.

However, it should be noted that despite the “hope” of fiscal support for the markets, longer-term “sell signals” only witnessed during major market topping processes currently remain as shown below.

sp500-marketupdate112116-2

The problem for the new Administration is the economy is already pushing in excess of 100% of debt-to-GDP which by its very nature reduces the impact of stimulative programs such as infrastructure spending. But the debt itself is also a problem and a point made today by Fed vice chair Fischer issued a clear warning as to the “enormous uncertainty around new US fiscal policies.”

  • FISCHER: NOT A LOT OF ROOM TO INCREASE U.S. DEFICIT WITHOUT ADVERSE CONSEQUENCES DOWN THE ROAD

But that is a story for another day.

For now, the market is ignoring such realities in the “hope” this time is different. The market has regained its running bullish trend line for now which keeps the“bulls” in charge.

As shown below, the breakout to new highs does clear the markets for a further advance. However, while the technicals suggest a move to 2400, it is quite possible it could be much less. Notice in the bottom section of the chart below. Turning the current “sell signal” back into a “buy signal” at such a high level does not give the markets a tremendous amount of runway.

sp500-marketupdate112116-6

Furthermore, the market is also pushing into resistance of the previously supportive bullish trend lines. This may limit the upside advance temporarily as the markets work off the currently extreme overbought conditions following the advance from the election lows. 

sp500-marketupdate112116-5

There is also the issue of deviations above the long-term trend line. Trend lines and moving averages are like “gravity.”  Prices can only deviate so far from their underlying trends before eventually “reverting to the mean.” However, as we saw in 2013-14, given enough liquidity prices can remain deviated far longer than would normally be expected.  (I have extrapolated move to 2400 using weekly price data from the S&P 500.)

A move to 2400 would once again stretch the limits of deviation from the long-term trend line likely leading to a rather nasty reversion shortly thereafter.

sp500-trendline-100316

We can see the deviation a little more clearly in the analysis below. Once again, the data in the orange box is an extrapolated price advance using historical market data. The dashed black line is the 6-month moving average (because #BlackLinesMatter) and the bar chart is the deviation of the markets from price average.

Historically speaking deviations of such an extreme rarely last long. As discussed above, while it is conceivable that a breakout of the current consolidation pattern could lead to a sharp price advance, it would likely be the last stage of the bull market advance before the next sizable correction. 

sp500-deviation-6mma-100316


This Won’t End Well

As shown in the first chart above, the rising in the dollar and interest rates will lead to an explosion somewhere in the economy and the markets that will negate a good chunk, if not all, of any fiscal policy measures implemented by the next administration.

Where, and when, are the two questions that can not be answered.

How big of a correction could be witnessed? The chart below, once again extrapolated to 2400, shows the mathematical retracement levels based on the Fibonacci sequence. The most likely correction would be back to 2000-ish which would officially enter “bear market” territory of 23.6%. However, most corrections, historically speaking, generally approach the 38.2% correction level. Such a correction would be consistent with a normal recessionary decline and bear market. 

sp500-fibonnaci-retracement-100316

Of course, given the length and duration of the current bull-market with extremely weak fundamental underpinnings, leverage, and over-valuations, a 50% correction back towards the 1300 level is certainly NOT out of the question.  Let’s not even discuss what would happen if go beyond that, but suffice it to say it wouldn’t be good.

And when it does, the media will ask first “why no saw it coming.” Then they will ask “why YOU didn’t see it coming when it so obvious.” 

In the end, being right or wrong has no effect on the media as they are not managing money nor or they held responsible for consistently poor advice. However, being right or wrong has a very big effect on you.

Yes, a move to 2400 is viable, but there must be a sharp improvement in the underlying fundamental and economic backdrop. Right now, there is little evidence of that in the making, and with the rise of the dollar and rates, the Fed tightening monetary policy and real consumption weak there are many headwinds to conquer. Regardless, it will likely be a one-way trip and it should be realized that such a move would be consistent with the final stages of a market melt-up.

As Wile E. Coyote always discovers as he careens off the edge of the cliff, “gravity is a bitch.”

The Real Value Of Cash

$
0
0

Submitted by Lance Roberts via RealInvestmentAdvice.com,

It’s the Fed’s fault.

Over the past several years, the Federal Reserve has forced interest rates lower in an all-out assault on“cash.”

The theory was simple. Make returns on “cash” so low it is forced out of savings account and into risk assets. 

It worked.

But here is the problem.

While the ongoing interventions by the Federal Reserve have certainly boosted asset prices higher, the only real accomplishment has been a widening of the wealth gap between the top 10% of individuals that have dollars invested in the financial markets and everyone else. This was shown by the Fed’s most recent consumer survey.

With the average American still living well beyond their means, the reality is that economic growth will remain mired at lower levels as savings continue to be diverted from productive investment into debt service. This skew in wealth, between the top 10% and bottom 90%, has distorted much of the economic data which suggests savings rates and incomes are rising across the broad spectrum of the economy.The reality, as shown by repeated studies and surveys, is an inability for many individuals to meet even small emergencies, must less being anywhere close to having sufficient assets to support a healthy retirement. To wit:

Take a look at that graphic carefully.

  • 33% of Americans have $0 saved for retirement.
  • 56% only have $0-$10,000
  • 66% have less than one-year of median income saved.
  • 74% have less than $100,000 saved for retirement.

With 3/4th’s of America dependent upon an already overburdened social security system in retirement, the “consumption function,” on which roughly 70% of the economy is dependent, is being grossly overestimated. 

The Risk Of Holding Cash

As I noted in this past weekend’s missive, the level of cash being held by individual investors currently is near record lows.

Of course, Wall Street, analysts and the media have been all complicit in the “war on cash.”

The argument against holding cash is simply this:

“Since there is “no yield on cash,” you MUST invest in the stock market otherwise you are losing money due to inflation and opportunity costs.”

This is a true statement ONLY IF you hold cash for an EXTREMELY long period. However, holding cash as a “hedge” against market volatility during periods of elevated uncertainty is a different matter entirely. 

It is relatively unimportant the markets are making new highs. The reality is that new highs only represent about 5% of the market’s action while the other 95% of the advance was making up previous losses. “Getting back to even” is not a long-term investing strategy.

In a market environment that is extremely overvalued, the projection of long-term forward returns is exceedingly low. I have discussed this previously, but this cannot be overstated enough. This, of course, does not mean that markets just trade sideways, but in rather large swings between exhilarating rises and spirit-crushing declines. This is an extremely important concept in understanding the “real value of cash.”

The chart below shows the inflation-adjusted return of $100 invested in the S&P 500 (capital appreciation only using data provided by Dr. Robert Shiller). The chart also shows Dr. Shiller’s CAPE ratio. However, I have capped the CAPE ratio at 23x earnings which has historically been the peak of secular bull markets in the past. Lastly, I calculated a simple cash/stock switching model which buys stocks at a CAPE ratio of 6x or less and moves back to cash at a ratio of 23x.

I have adjusted the value of holding cash for the annual inflation rate which is why during the sharp rise in inflation in the 1970’s there is a downward slope in the value of cash. However, while the value of cash is adjusted for purchasing power in terms of acquiring goods or services in the future, the impact of inflation on cash as an asset with respect to reinvestment may be different since asset prices are negatively impacted by spiking inflation. In such an event, cash gains purchasing power parity in the future if assets prices fall more than inflation rises.

While no individual could effectively manage money this way, the importance of “cash” as an asset class is revealed. While cash did lose relative purchasing power, due to inflation, the benefits of having capital to invest at lower valuations produced substantial outperformance over waiting for previously destroyed investment capital to recover.

While we can debate over methodologies, allocations, etc., the point here is that “time frames” are crucial in the discussion of cash as an asset class. If an individual is “literally” burying cash in their backyard, then the discussion of the loss of purchasing power is appropriate.

However, if cash is a “tactical” holding to avoid short-term destruction of capital, then the protection afforded outweighs the loss of purchasing power in the distant future.

Much of the mainstream media will quickly disagree with the concept of holding cash and tout long-term returns as the reason to just remain invested in both good times and bad. The problem is it is YOUR money at risk. Furthermore, most individuals lack the “time” necessary to truly capture 30 to 60-year return averages.

8-Reasons To Hold Cash

I’ve been managing money in some form coming up on 30-years. I learned a long time ago that while a “rising tide lifts all boats,” eventually the “tide recedes.” I made one simple adjustment to my portfolio management over the years which has served me well. When risks begin to outweigh the potential for reward, I raise cash.

The great thing about holding extra cash is that if I’m wrong, simply make the proper adjustments to increase the risk in my portfolios. However, if I am right, I protect investment capital from destruction and spend far less time “getting back to even” and spend more time working towards my long-term investment goals.

Here are my reasons having cash is important.

1) We are not investors, we are speculators. We are buying pieces of paper at one price with an endeavor to eventually sell them at a higher price. This is speculation at its purest form. Therefore, when probabilities outweigh the possibilities, I raise cash.


2)80% of stocks move in the direction of the market. In other words, if the market is moving in a downtrend, it doesn’t matter how good the company is as most likely it will decline with the overall market.


3)The best traders understand the value of cash. From Jesse Livermore to Gerald Loeb they all believed one thing – “Buy low and Sell High.” If you “Sell High” then you have raised cash. According to Harvard Business Review, since 1886, the US economy has been in a recession or depression 61% of the time. I realize that the stock market does not equal the economy, but they are somewhat related.


4)Roughly 90% of what we’re taught about the stock market is flat out wrong: dollar-cost averaging, buy and hold, buy cheap stocks, always be in the market. The last point has certainly been proven wrong because we have seen two declines of over -50%…just in the past two decades! Keep in mind, it takes a +100% gain to recover a -50% decline.


5)80% of individual traders lose money over ANY 10-year period. Why? Investor psychology, emotional biases, lack of capital, etc. Repeated studies by Dalbar prove this over and over again.


6) Raising cash is often a better hedge than shorting. While shorting the market, or a position, to hedge risk in a portfolio is reasonable, it also simply transfers the “risk of being wrong” from one side of the ledge to the other. Cash protects capital. Period. When a new trend, either bullish or bearish, is evident then appropriate investments can be made. In a “bull trend” you should only be neutral or long and in a “bear trend” only neutral or short. When the trend is not evident – cash is the best solution.


7) You can’t “buy low” if you don’t have anything to “buy with.” While the media chastises individuals for holding cash, it should be somewhat evident that by not “selling rich” you do not have the capital with which to “buy cheap.”


8) Cash protects against forced liquidations. One of the biggest problems for Americans currently, according to repeated surveys, is a lack of cash to meet emergencies. Having a cash cushion allows for working with life’s nasty little curves it throws at us from time to time without being forced to liquidate investments at the most inopportune times. Layoffs, employment changes, etc. which are economically driven tend to occur with downturns which coincide with market losses. Having cash allows you to weather the storms. 

Importantly, I am not talking about being 100% in cash. I am suggesting that holding higher levels of cash during periods of uncertainty provides both stability and opportunity.

With the fundamental and economic backdrop becoming much more hostile toward investors in the intermediate term, understanding the value of cash as a “hedge” against loss becomes much more important. 

As John Hussman noted in one of his past missives:

The overall economic and financial landscape, then, is one where obscene valuations imply zero or negative S&P 500 total returns for more than a decade — an outcome that is largely baked-in-the-cake regardless of shorter term economic or speculative factors. Presently, market internals remain unfavorable as well. Coming off of recent overvalued, overbought, overbullish extremes, this has historically opened a clear vulnerability of the market to air-pockets, free-falls and crashes.”

As stated above, near zero returns do not imply that each year will have a zero rate of return. However, as a quick review of the past 15 years shows, markets can trade in very wide ranges leaving those who “rode it out” little to show for their emotional wear.

Given the length of the current market advance, deteriorating internals, high valuations, and weak economic backdrop; reviewing cash as an asset class in your allocation may make some sense. Chasing yield at any cost has typically not ended well for most.

Of course, since Wall Street does not make fees on investors holding cash, maybe there is another reason they are so adamant that you remain invested all the time.

How The Coming Wave Of Job Automation Will Affect You

$
0
0

Submitted by David Galland via The Passing Parade

One of the more interesting mental exercises related to predicting the future involves trying to fathom the impact the rise of robots will have on humanity.

We can be quite sure that in the proverbial blink, robots will be doing all the war fighting. After that, what’s the point? But does that then lead to the sort of robotic apocalypse so well envisioned in Terminator?

I also suspect it’s only a matter of time before the idea of sex bots goes from being an “eew” sort of thing to a household appliance. Well, at least in some households. After all, we already live in a world where every possible iteration of sexual proclivity is not just accepted but celebrated. So, who’s to deny the unmated a good snogging from the Yabadabdo Sexbot 2000?

In fact, in a recent survey, 1 in 4 adults aged 18 to 34 said they would “date” a robot. But what will the impact of bionic sex partners be on society—or birth rates, for that matter? It’s all but impossible to see through the fog to the answers.

We already haverobo news reporters (you didn’t actually think humans write the crap passed off for news these days, did you?) Of course, as the news writing programs become more and more sophisticated, might the algorithms be tweaked to influence the masses to buy an advertiser’s product or, more onerously, to create a desired political outcome? You know, kind of how Google tried to get Hillary elected?

In terms of managing money, we already have robo traders and robo advisors. But what happens when these technologies become self-learning? Will the competing programs become so adept at exploiting kinks in the armor of Mr. Market that they will effectively nullify each other?

It’s also abundantly clear that self-driving cars will become the norm within the next decade. As someone who hates driving, that is a development I eagerly await. But imagine the sweeping changes self-driving cars will have on insurance, road building, car manufacturers, trucking, energy usage, the urban landscape, the taxi industry, government and regulations (will we still need driver’s licenses?), senior mobility, etc. It’s staggering to contemplate, and it’s just over the horizon.

I could continue, but as I am preparing for a trip to Tafí de Valle in the neighboring province of Tucumán here in Argentina tomorrow morning, I’ll shuffle toward the featured article of this week’s musings—a look at the impact of automation on the structure of the workforce by friend and associate Stephen McBride.

This is a particularly interesting topic on many levels. What percentage of the workforce is at risk of being replaced by automation? Where will the displaced find new jobs? What job skills will remain largely immune to automation? How will the US government, which is funded to the tune of 92% by income-related taxes, replace the lost revenue… a robot tax?

It’s a big topic, too big for a single Parade, but we must start somewhere. And with that, I turn the podium over to Stephen.

How the Coming Wave of Job Automation Will Affect You

By Stephen McBride


The 227,000 jobs added to the payroll in January marked the 76th straight month of expansion. The headline number is impressive. But if you dig a little deeper, you’ll find these jobs “aren’t what they used to be.”


Since 2000, the creation of full-time positions has slowed significantly. The private sector used to add full-time jobs at 2–3% per annum. In 2000, that number fell below 2%. Since 2008, it has been below 1%.


The majority of positions created since 2010 have been temporary. Around 20–50% of employees at the likes of Google and Walmart now fall into this category. With the explosion of contract workers, “workforce solution” firms now generate an estimated $1 trillion in revenue every year.


The declining quality of jobs has caused many to stop looking for work. The labor force participation rate is near the lowest level since 1978. Hordes of Baby Boomers retiring skews the data somewhat, but the rate for workers in their prime isn’t pretty either. Almost 12% of men aged 25–64 aren’t in the workforce—a near five-fold increase in 60 years.


So what has caused this shift?


Automation Annihilation

Steven Berkenfeld, a managing director in the investment banking division at Barclays, summed up the thought process of companies hiring today: “Can I automate it? If not, can I outsource it? If not, can I give it to an independent contractor?” Hiring an employee is the last resort.


Over the past four decades, millions of jobs have been lost to automation. The manufacturing sector is a prime example. While productivity has increased, employment has fallen.


We can see this trend when comparing companies across time. The most valuable US firm in 1964 was AT&T. Then, it was worth $267 billion (in 2016 dollars) and employed 758,611 people. Today, Google is worth $370 billion and has only 55,000 employees.


Many workers have already been replaced by machines, but the number is only set to rise.


A 2013 study from the University of Oxford concluded that 47% of jobs in the US will likely be automated over the next two decades. And a 2015 report by McKinsey found that the majority of tasks performed in sectors like manufacturing and food service can be automated with currently demonstrable technology.


Technological advancement has created more jobs than it has destroyed in the past. However, the big problem is the lag time it takes to forge those new careers. Given the high cost of living in the US today, even a small lag could be financially devastating.


Let’s take a look at the implications of job displacement going forward…


The Missing Middle

Due to an inability to secure a full-time job, McKinsey estimates 20–30% of workers now partake in contingency work to supplement their income. Work in the “gig economy” can be fun, but it doesn’t provide a stable, reliable wage. Sure, one can survive on it, but it’s hard to get mortgage approval or support a family with it.


One of the reasons the US became an economic behemoth was its large middle class. With the loss of traditional careers, this trend is now in reverse. Over time, employment will likely become polarized as “Middle America” is hollowed out.


Robots


Lower-quality careers ultimately mean lower pay… and when incomes drop, people have less to spend. Given that consumption now accounts for 70% of economic activity, this is a matter of great concern. As the Fed has stated: Recoveries don’t die of old age. It’s usually falling demand that leads to their death.


Many Americans are unable to find full-time employment, but they are spending more trying to attain it. Outstanding student loans now total a whopping $1.4 trillion. This isn’t a problem if individuals have the ability to pay. But with 45% of recent college graduates underemployed and 10% over 90 days late on payments, it’s a big problem.


In 2013, the Department of Labor predicted 65% of school children will be employed in jobs that don’t yet exist. Therefore, many of the skills they are learning today will likely be obsolete in the near future.


And it’s not only job seekers who are affected. With dependency ratios collapsing, who will fund the pensions of the retiring Boomers?


Displacement does not only have economic consequences, it also has profound social consequences. A Gallup study found that having a job was the number one social value. Unemployment is linked to increased drug use and depression. It’s also positively correlated with crime.


While automation will have a major impact on the future of employment, the outlook is not all bad.


Machines may be rendering many skills useless, but creativity is where humans still have an edge. McKinsey listed “managing others” and “applying expertise” as the least susceptible to automation. Likewise, Deloitte identified cognitive skills as the most important to have going forward.


Machines may be advancing, but the future is likely to be one of collaboration, not competition. There will be serious challenges in the near term as many jobs are displaced by technology. But in the end, who would bet against the “ascent of man”?

Why Charles Gave Expects "Total Mayhem" In France Even If Macron Is Elected

$
0
0

Venerable French investor Charles Gave has been managing money and researching markets for over 40 years; as such France’s elder statesman of asset allocation perhaps best captures the mood ahead of the most crucial Presidential election in a generation. In conversation with Dr. Pippa Malmgren, Charles breaks down national politics to understand why voters have rejected the establishment and the market impact of both outcomes, and what to expect from tomorrow's election.

First, Gave, who says "I'm not so sure that Macron will win", is asked by Malmgren to walk RealVision viewers through what Macron's agenda would look like in case of a victory. Gave is unable to do so for several simple reasons:

Well, first, nobody knows. Because during the whole campaign, all these talks were on one hand, on the other. I'm in favor of apple pie, and motherhood, you see. Basically he has, to my knowledge, very little program. So he's running. That is what Hollande said. That he was going to make some fundamental changes without hurting people. And so Macron is a big, empty suit. That's what he is. You did the right curriculum vitae, he went to the right schools. And you have the feeling that the guy never had an original idea in his life. He was always a good student.


And moreover, there is a strong suspicion that he's a kind of golem created by Hollande and all these guys. So since they knew they were going to lose the election, they created a guy in a hologram that would run for them and prevent them from losing power. So to a certain extent, the French political system has been captured by what you can call the Technocratic class. And whether from the left or the right, it didn't make any difference. And this Technocratic class is presenting Macron as a brand new fellow. He is nothing brand new. These guys have been in power for 50 years for God's sakes. So this is basically nothing.

Gave is then asked for his take on the market's reaction, first to the outcome which now appears to be fully priced in, i.e., a Macron victory. The French investor's response should be concerning to those who believe France is in for a period of calm and stability.

If Macron is elected, as I already said, I'm not sure it's not going to be a triumphant election. So I'm not sure they will have that much legitimacy at first. And second thing is that just after, we have the election for the French Parliament. And then it's going to be a total mayhem. Because you have four main different currents in France. The extreme left, the Macron left, you see? You have the Fillon right, and you have Le Pen's right. So you have four. The way it's done before is that you had only three. Extreme left and the left were joined. And you had the election, you had three guys, and if anyone from the Front National had any chance of being elected, then the worst position of the other two retired. Right away. And said, you must vote for my usual enemy, but we don't want to. It’s what’s called the Front Republic.


But you see, it's kind of easy to organize if the organization of the parties are very strong and can force people to retire and to stop running. But if you have four, the organization of the parties having lost all credibility, then nobody is going to retire. Until we are going to have elections. And you could have a majority of MP's from the Front National The majority of MP's from Melenchen. Anything is possible. So the fact that Macron is elected doesn't reduce at all. Not at all. The political risk in France. It may reappear at the election time, big time. So anybody who buys on the idea that the problem is solved in France, let’s move to the next one will have to wait till the middle of June.

Alternatively, what if Le Pen wins:

If Le Pen wins, it's pretty simple. The bond market in France, Italy, Spain cannot open on Monday morning. And I suppose the euro is dead in the following week. And then you have to buy Europe like crazy. Southern Europe.

Why Southern Europe? Because it is Germany's markets that would bear the brunt of the selloff, as the dissolution of the euro and European Union would effectively bring about the end of Germany's economic hegemony (while at the same time benefitting France).

The Germans have made a colossal mistake, which is that they have all the production in Germany. So they're extremely efficient, well-organized, and they have developed massive current account surpluses. Half of that surplus is in cars. The margin on cars is around 4%. Imagine that the euro breaks down. The deutschmark comes back. The deutschmark goes up 15, 20%. And the whole German industry, all the production base in Germany, becomes bankrupt in no time at all. Compare that to France. France we have magnificent big companies that have been intelligent enough to produce everywhere in the world, to operate from everywhere in the world, and be totally independent from what's happening in France. What they have in France is their headquarters. And that's about it. So if Europe breaks, you should be long France on the stock market, and short Germany. Big time.

Would a Le Pen victory also mean the end of the EU? Gave answers:

I wrote a book in 2002, sometime around then, called "Lions Led by Donkeys in France." It was kind of a bestseller. And I made the point in the book that the euro is going to destroy Europe, the European institutions. And I said, we must get rid of the euro to save Europe. So name of the game, if we have some kind of a crisis like that, is to basically close the market for three weeks and organize an orderly dismembering of the euro. But to maintain what has been good so far, which is the kind of common market. And it's a difficult call because the movement towards the euro was also a movement to create a European nation.


And so the institutions today are basically federal in nature. But nobody in Europe has ever voted for them. So to a certain extent, the guys with power in Brussels have not been elected by anybody, and you cannot fire them. So it's totally Technocratic. So we have a hell of a problem. We should not only destroy the euro, but should move back to what Europe was in 1988 or 1987 before they put all these Federalist legislations in. That is going to be a tall order. But if the euro disappears and Europe has a problem, then the negotiating between the UK and Europe is going to be amusing. Because UK is going to say, look, who are we going to negotiate with?

Finally, on his big picture thoughts ahead of tomorrow's decisive election:"it's going to be a close call, a lot closer than people think. And then we have the elections afterwards, which are going to be a total gamble." Gave adds that in a sense Le Pen has already won because the "worst case scenario" for her, the 2022 elections, is still achievable. As for the parliamentary elections, "Le Pen could have anywhere between 40 to 100 MP's (she currently has two).... which would be a total disaster for the ruling class."

In other words, even if Macron triumphs on Sunday, "the National Front isn't going anywhere." Furthermore, Le Pen's niece Marion Le Pen is poised to inherit the mantle of party leadership in time for the next presidential election in 2022. The younger Le Pen, already a French MP, would have a distinct advantage over her astringent aunt:

Marion, she's very young. She's 27, 28. She's an MP in the French Parliament. She's extremely pretty. And she represents what's probably very good in the French Catholic Right. She's very much a Christian person. Very much so. So a lot of people have problems voting for Mrs. Le Pen today. A lot of the Fillon's elector would have absolutely no problem voting for Marion, you see what I mean? So she has a big appeal on the Classical French Right. Big one. Big one.

His parting words:"be careful. If she wins, you will have a disaster in the lot of the European bond market. Doesn't mean a total disaster for the good quality companies. But the risk is not on the stock market. The risk is on the bond market. So be careful. Don't overstay on the bonds in Europe."

While these are the core excerpts from the interview with Charles Gave, there is much more in the full 40 minute version found on RealVision TV.

Stocks - Breakout Or Fakeout?

$
0
0

Authored by Lance Roberts via RealInvestmentAdvice.com,

In this past weekend’s newsletter, I discussed the relatively “weak” breakout of the market to new record highs. To wit:

“Over the last few weeks, I have been discussing the ongoing consolidation process for the S&P 500 from the March highs. (For a review read: “Oversold Bounce Or Return Of The Bull,” and “Return Of The Bull…For Now.”) As the expected rally in stocks, and reversal in bonds, took shape as the S&P 500 was finally able to ratchet a record close at 2399.29. (Read: 10/2016 – “2400 Or Bust”)


“With the market on a short-term ‘buy signal,’ deference should be given to the probability of a further market advance heading into May. With earnings season in full swing, there is a very likely probability that stocks can sustain their bullish bias for now.


The market did do exactly that this past week, and while hitting a new high, as noted above, it was a ‘weak’ breakout as volume contracted.”

The question for the bulls, of course, is whether the current “breakout” is sustainable, or, is it a “fakeout” that reverses back into the previous trading range? As Steve Reitmeister from Zack’s Research suggested on Monday:

“I would say it all depends on investor confidence that tax breaks are on the way.”

It all hangs on just one issue.

As I have discussed previously, there is a huge risk with respect to the timing and extent of tax reform there will be.

“Given the current problems in Washington D.C. in getting legislative agenda agreed to by Congressional Republicans, delays should be expected.”

“The question, of course, is just how much time the markets will give Washington to make progress on legislative agenda? As noted above, the estimates currently driving stocks were based on tax cuts being brought through to boost bottom line profitability. If those cuts don’t happen soon, earnings disappointments may bite investors.”

It is that potential for disappointment given the overly bullish earnings estimates which poses the greatest risk to investors given the currently elevated levels of valuations.

There is no arguing corporate profitability improved during 2016 as oil prices recovered. The recovery in oil prices specifically helped sectors tied to the commodity such as Energy, Basic Materials, and Industrials.

Currently, while earnings have ticked up modestly with the recovery in oil prices, the price of the S&P 500 has moved substantially more than the earnings recovery would justify.

Furthermore, the recovery in earnings, without the direct bottom line impact from tax cuts, may be fleeting as the dollar remains persistently strong. 

Of course, we already know much of the rise in “profitability,” since the recessionary lows, has come from a variety of cost-cutting measures and accounting gimmicks rather than actual increases in top line revenue. As shown in the chart below, there has been a stunning surge in corporate profitability despite a lack of revenue growth.

Since 2009, the reported earnings per share of corporations has increased by a total of 221%. This is the sharpest post-recession rise in reported EPS in history. However, that sharp increase in earnings did not come from revenue which is reported at the top line of the income statement. Revenue from sales of goods and services has only increased by a marginal 28% during the same period.

In order for profitability to surge, despite rather weak revenue growth, corporations have resorted to four primary weapons: wage reduction, productivity increases, labor suppression and stock buybacks.  The problem is that each of these tools creates a mirage of corporate profitability which masks the real underlying weakness of the overall economic environment. Furthermore, each of the tools used to boost EPS suffer from both being finite in nature and having diminishing rates of return over time.

Of course, given the weakness in revenue growth, it is not surprising the markets are anxiously awaiting “tax cuts” which are a direct injection into bottom line earnings per share.

Importantly, it should be remembered that “tax cuts” will impact“earnings growth” rates for JUST ONE YEAR.

Let me explain:

  • Year-1 earnings = $1.00 per share.
  • Tax cuts add $0.30 per share in bottom lines earnings.
  • Year-2 earnings = $1.30 per share or 30% growth.
  • Year-3 earnings growth (assuming no organic growth) = $1.30 per share or 0% growth.

While tax cuts are certainly welcome as a boost to bottom line earnings, it should be remembered earnings growth must be sustained indefinitely to justify valuations at current levels.

Such is unlikely to happen.

With the Senate getting ready to scrap Congresses “AHCA” bill, and write their own plan which will then have to go back to Congress where the debates will begin again, it will likely take MUCH longer to get to tax reform than currently expected.

The problem, technically is that while the stock market is continuing to push higher, the internal strength continues to diminish as shown by both the number of stocks on bullish buy signals and the number trading above their respective 200 day moving averages.

Furthermore, with the volatility level now pressed to its lowest levels since 2007, combined with an extreme overbought condition, a sell signal at a high level, and a large deviation from the 200-dma, the risk of a short to intermediate-term correction has risen markedly.

S&P 3000…Or 1500

It would not surprise me to see the markets break out and attempt to push higher in the current environment. This is particularly the case as the confluence of Central Banks continue to buy assets, $1 Trillion since the beginning of the year, increased leverage and the embedded belief “There Is No Alternative (TINA).”  

It would be quite naive to suggest otherwise.

The chart below is a Fibonacci retracement/extension chart of the S&P 500. I have projected both a 123.6% advance from the 2009 lows as well at a standard 50% retracement using historical weekly price movements.

From the bullish perspective, a run to 3000, after a brief consolidation following an initial surge to 2500, is a distinct possibility. Such an advance is predicated on earnings and economic growth rates accelerating with tax cuts/reform being passed.

However, given the length of the economic and market cycle, there is a significant bear case being built which entails a pullback to 1543. Such a decline, while well within historical norms, would wipe out all gains going back to 2014. 

Just for the mathematically challenged, this is NOT a good risk/reward ratio.

  • 3000 – 2399 (as of Monday’s close) =  601 Points Of Potential Reward 
  • 2399 – 1543 = -856 Points Of Potential Loss

With a 1.3 to 1 risk/reward ratio, the potential for losses is far more damaging to your long-term investment goals than the gains available from here.

Moreover, the bearish case is also well supported by the technical dynamics of the market going back to the 1920’s, it would be equally naive to suggest that “This Time Is Different (TTID)” and this bull market has entered a new “bull phase.” (The red lines denote levels that have marked previous bull market peaks.)

Of course, as has always been the case, in the short-term it may seem like the current advance will never end.

It will.

And when it does the media will ask first “why no saw it coming.” Then they will ask “why YOU didn’t see it coming when it so obvious.” 

In the end, being right or wrong has no effect on the media as they are not managing money nor or they held responsible for consistently poor advice. But, being right or wrong has a very big effect on you.

Yes, a breakout and a move higher is certainly viable in the current “riskless” environment that is believed to exist currently.

However, without a sharp improvement in the underlying fundamental and economic back drop the risk of failure is rising sharply. Unfortunately, there is little evidence of such a rapid improvement in the making. Either that, or a return to QE by the Fed which would be a likely accommodation to offset a recessionary onset.

In either case, it will likely be a one-way trip higher and it should be realized that such a move would be consistent with the final stages of a market melt-up.

Just as a reminder…“gravity is a bitch.”


Thirteen Reasons Why: America’s High Schools Are Creating (Another) Lost Generation

$
0
0

Interested in precious metals investing or storage? Contact usHERE 


Thirteen Reasons Why: America’s High Schools Are Creating (Another) Lost Generation

Written by Peter Diekmeyer (CLICK HERE FOR ORIGINAL)


Netflix’s recent announcement that it would be producing a second season of Thirteen Reasons Why has raised new questions about the disastrous state of the US public school system and its effects on the economy.


“Hey, it’s Hannah Baker,” says the show’s protagonist, played by a stunning Katherine Langford in the opening episode. “Get settled in. Because I'm about to tell you the story of my life. More specifically, why my life ended.”


The Thirteen Reasons’ portrait of how a stifling, bureaucratic system progressively cuts this teenage girl to pieces, eventually driving her to death, provides a dramatized, insightful reflection on (another) emerging lost generation.


The statistics are grim: a third of 18- to 34-year-olds in the U.S. live at home according to the US Census Bureau. Homeserve USA finds that nearly one in three Americans can’t come up with $500 to fund an emergency. As if that were not enough, according to the US Congressional Budget Office, governments have saddled today’s young with more than $100 trillion worth of pension and healthcare debts.


The harder truth depicted in Thirteen ReasonsWhy is that today’s high school graduates emerge with few skills, little education and a sanitized view of the world. In short, they are totally unprepared to take on the challenges they face.


Following are Thirteen Reasons Why:


1. Thirteen years in jail


In Thirteen Reasons, Hannah, the bullied protagonist has no way to escape a toxic environment. Her helpless position progressively worsens and eventually drives her to suicide.


Because education is compulsory in the United States, Hannah lives in a de facto prison. She cannot change schools or classes without parental approval and undergoing a humiliating bureaucratic process.


An education system that prioritized learning would put students at the center, leaving them free to choose their schools, classes, teachers and programs.


2. American kids can’t vote


The challenges facing American kids are exacerbated by the fact that they aren’t allowed to vote. They thus have little stake in the system, no sense of responsibility and adopt a de facto poise of helplessness.


3. Students come last


None of the dozen studies reviewed for this article assessed the US public education system based on students’ needs.


Governments prioritize public education based on its effects on national competitiveness. Businesses focus on getting skilled workers (whose training they don’t want to pay for). Teachers’ unions focus on salaries and working conditions.


The upshot is that students’ interests come last.


4. Bloated administrations


America spends more per student than any other country yet ranks 14th in terms of results, behind Russia. Must of this is due to legions of highly-paid administrators that clog the system with rules, regulations and forms, few of which prioritize education.


5. Kids taught to worship government; shun individual responsibility


The young have always been concerned with social causes. It’s thus hardly surprising that teachers would encourage students to prioritize government’s role in healthcare, welfare and environmental regulation.


However today’s public schools offer essentially no counter arguments about individual responsibility.


High school graduates thus emerge as easy prey for politicians who claim that near-unlimited government spending and borrowing are the cure for the nation’s problems. (See the Krugman con).


6. Public schools teach no marketable skills


The greatest indictment of the public school system’s actual performance relates to the fact that students graduate with no marketable skills.


If America’s kids emerged from schools able to read, write, do basic math, type, work as a team and use a half dozen common software packages, they would have something to show for their 13 years in the slammer.


7. Banning Ayn Rand and Huckleberry Finn


Socrates’ motto at the Agora was to “question everything.” However public schools prioritize politically correct doctrine that consciously excludes key ideas and concepts.


Ayn Rand, the most important philosopher of the 20th century, is essentially banned from the public system, as is Mark Twain’s Huckleberry Finn, which Hemingway cited as the root of American literature. History teaching in America, as Niall Ferguson has noted, is sanitized to the point of rendering it almost counterproductive.


8. State-directed curricula: one size fits all


Students vary as do the communities they live in. However a disproportionate amount of teaching is dictated by bureaucrats. This leaves teachers little flexibility to adjust based on students’ needs.


These differ based on whether the school in located in poorer neighborhoods where many students come from single family homes, or in upper middle-class professional communities where traditional family structures are more common.


9. Kids graduate clueless about finances


Public schools teach essentially nothing about managing money, likely the single most important life skill a kid could have. Students graduate thus thinking that borrowing is fine.


This leaves them prey to America’s biggest predatory lenders: big universities, which have managed to saddle youth with $1.2 trillion worth of debts, many of whom have little to show for it.


10. “Hoop jumper” worship: drives out the talented and curious


One of the biggest weaknesses in public and private schools is their collective worship of “hoop jumpers,” - that universal collection of the obsequious sorts that clutter Dean’s lists and other “Top Students” awards.


This wouldn’t be a problem if schools were able to correctly identify top performers. However heavy state-defined curricula force teachers to “teach to the test.”


This leads to the advancement of drone-like students who are able to recite mindless data, massaged concepts and formulas, and more dangerously: with the need to guess and kow-tow to what teachers want them to say.


Worse, in two centuries of public schooling, teachers still fall for that old trap of giving the best marks to kids with nice hand-writing or to math students who get the wrong answer but manage to “show their work.” Students who challenge conventional thinking are smiled at and given a B.


The upshot is the students with drive, curiosity and creativity are quickly driven out.


The number one students - like John Maynard Keynes, the father of modern economics, who taught that the best way to get rich was to spend more than you earn - rocket through the system, and now run the nation’s central banks and university economics departments.


You get the picture.


11. Powerful unions


In a world in which students are stuck in de facto prisons, teachers, who spend more time with them than their parents do, ought to be their biggest backers. They aren’t.


Teachers thus need to accept the lion’s share of the blame for the disastrous state of American schools.


That blame starts with the fact that teachers’ first priority has been to band into powerful unions, which put salaries, benefits and vacation time first and students’ interests last.


12. Millionaire teachers


True, teachers perform one of society’s most useful functions. However during a time of strained public finances students’ needs must come first - not teachers’ salaries.


The teachers’ unions have been hugely successful. Median compensation for US workers is $28,900. Teachers earn $58,000, almost double that amount.


The gap between teachers and those communities they teach in is exacerbated by the fact that gold-plated, state-guaranteed pensions mean that public school teachers generally retire as millionaires.


If teachers were paid at market rates, there would be more money available to fund students’ needs such as smaller class sizes, libraries and computers.


13. Mediocre teachers that can’t be fired


Teachers begin their careers ranked among most socially-committed of any professionals. But as with any human beings, a change takes hold of teachers once they acquire tenure and can no longer be fired.


Office hours and volunteer activities shrink, emails from students and parents are returned slower, if at all. The upshot is that many of the best teachers decline towards mediocrity as their careers advance.


*****


The takeaway for the alternative investors, who wonder how the American public could so easily fall for politicians, economists and central bankers that are running US productivity into the ground, the answer is clear.


America’s public schools may be leaving their graduates incapable of assessing the stakes.


Questions or comments about this article? Leave your thoughts HERE.


Thirteen Reasons Why: America’s High Schools Are Creating (Another) Lost Generation

Written by Peter Diekmeyer (CLICK HERE FOR ORIGINAL)

"This Market Is Crazy": Hedge Fund Returns Hundreds Of Millions To Clients Citing Imminent "Calamity"

$
0
0

While hardly a novel claim - in the past many have warned that Australia's housing and stock market are massive asset bubbles (which local banks were have been forced to deny as their fates are closely intertwined with asset prices even as the RBA is increasingly worried) - so far few if any have gone the distance of putting their money where their mouth was. That changed, when Australian asset manager Altair Asset Management made the extraordinary decision to liquidate its Australian shares funds and return "hundreds of millions" of dollars to its clients according to the Sydney Morning Herald, citing an impending property market "calamity" and the "overvalued and dangerous time in this cycle".

"Giving up management and performance fees and handing back cash from investments managed by us is a seminal decision, however preserving client's assets is what all fund managers should put before their own interests," Philip Parker, who serves as Altair's chairman and chief investment officer, said in a statement on Monday quoted by the SMH.

The 30-year investing veteran said that on May 15 he had advised Altair clients that he planned to "sell all the underlying shares in the Altair unit trusts and to then hand back the cash to those same managed fund investors." Parker also said he had "disbanded the team for time being", including his investment committee comprising of several prominent bears such as former Morgan Stanley chief economist and noted bear Gerard Minack and former UBS economist Stephen Roberts.

Altair chairman and chief investment officer Philip Parker.

Parker said he wanted "to make clear this is not a winding up of Altair, but a decision to hand back client monies out of equities which I deem to be far too risky at this point."

"We think that there is too much risk in this market at the moment, we think it's crazy,"Parker said with a candidness few of his colleagues are capable of, at least when still managing money.

"Valuations are stretched, property is massively overstretched and most of the companies that we follow are at our one-year rolling returns targets – and that's after we've ticked them up over the past year. Now we are asking 'is there any more juice in these companies valuations?' and the answer is stridently, and with very few exceptions, 'no there isn't'."

Parker outlined a list of "the more obvious reasons to exit the riskier asset markets of shares and property". These include:

  • the Australian east-coast property market "bubble" and its "impending correction";
  • worries that issues around China's hot property sector and escalating debt levels will blow up "later this year";
  • "oversized" geopolitical risks and an "unpredictable" US political environment;
  • and the "overvalued" Aussie equity market.

But, to Parker, it was the overheated local property market that was the clearest and most present danger. "When you speak to people candidly in the banks, they'll tell you very specifically that they are extraordinarily worried about the over-leverage of the Australian population in general," he said. He flagged how exposed the country's lenders were to a correction.

"If they get a property downturn anything similar to 1989 to 1991 then they are going to have all sorts of issues," Parker said.

Parker's decision comes after a robust year of double-digit gains on the ASX. Not only that, but he is acting on his convictions by returning money to clients and abandoning the fees attached to a $2 billion advisory agreement.

Parker, however, displayed little nervousness about making such a significant decision. In fact, he said he has never been more certain of anything.

"Let me tell you I've never been more certain of anything in my life," Parker said. "I am absolutely certain we are in a bubble in this property market. Mortgage fraud is endemic, it's systemic, it's just terrible what's going on. When you've got 30-year-olds, who have never seen a property downturn before, borrowing up to 80 per cent to buy three and four apartments, it's a bubble."

In a rather dire forecast, Parker outlined a situation where the stock market could fall as low as 5200 points in the coming months, depending on the confluence of his identified risk factors.

"Australia hasn't had its GFC event, we've been living in this fool's paradise. But if China slows down the way the guys think it will towards the end of this year, then that's 70 per cent of our exports [affected]. You can see already that the commodity market is turning down."

Some speculated whether there is another motive behind the sudden shuttering, but Parker stridently denied any suggestion that there were other factors at play other than a pure investment decision. No personal issues, no position that has blown up and forced his hand. "No, God no," he said. "We've sold out all of our positions at huge profits for our clients."

"This game is all about reputation. I feel that we are right."

For now, Mr Parker said he was happy to take some time off. "I've never had more than five weeks off in a row. I'm probably going to have four months in a row, and if something happens in between, I'll think about it. Otherwise I'll enjoy the time off."

Come to think of it, in this "market", that may be the smartest thing to do.

"They're Going To Have All Sorts Of Issues" - Citi Urges Regulators To Address Australia's "Spectacular Housing Bubble"

$
0
0

Citigroup Chief Economist Willem Buiter says Australia is experiencing “a spectacular housing bubble” that needs to be addressed with tougher regulatory measures – something we’ve noted time and time again.

A shortage of housing, coupled with record-low interest rates, has made Sydney the world’s most second-most expensive property market. The city’s home prices jumped 16% in the 12 months through April, stoking record household debt and putting home ownership out of the reach of many.

"It had better be focused on immediately, to try and tether a soft housing landing,” Buiter told reporters in Sydney Wednesday, according to Bloomberg.“Clearly if these things are not managed well they can be a trigger for a cyclical downturn.”

Australia’s biggest banks have been tightening their lending standards under pressure from regulators, making home loans for investors and interest-only mortgages more expensive, Bloomberg reported.

The Reserve Bank of Australia, which has cited the east-coast property markets and their impact on financial stability as a key concern, is in a tough spot. While it’s reluctant to cut the benchmark interest rate from 1.5 percent and stoke prices even higher, lifting borrowing costs would place a greater burden on households saddled with debt already at 189 percent of gross domestic product, Bloomberg reported.

Investors, for their part, are starting to come around to the dangerously overvalued nature of Australian stock and housing markets. Earlier this week, Australian asset manager Altair Asset Management made the extraordinary decision to liquidate its Australian shares funds and return "hundreds of millions" of dollars to its clients according to the Sydney Morning Herald, citing an impending property market "calamity" and the "overvalued and dangerous time in this cycle".

Parker said he wanted "to make clear this is not a winding up of Altair, but a decision to hand back client monies out of equities which I deem to be far too risky at this point."

"We think that there is too much risk in this market at the moment, we think it's crazy," Parker said with a candidness few of his colleagues are capable of, at least when still managing money.

"Valuations are stretched, property is massively overstretched and most of the companies that we follow are at our one-year rolling returns targets – and that's after we've ticked them up over the past year. Now we are asking 'is there any more juice in these companies valuations?' and the answer is stridently, and with very few exceptions, 'no there isn't'."

Parker outlined a list of "the more obvious reasons to exit the riskier asset markets of shares and property". These include:

  • the Australian east-coast property market "bubble" and its "impending correction";
  • worries that issues around China's hot property sector and escalating debt levels will blow up "later this year";
  • "oversized" geopolitical risks and an "unpredictable" US political environment;
  • and the "overvalued" Aussie equity market.

But, to Parker, it was the overheated local property market that was the clearest and most present danger. "When you speak to people candidly in the banks, they'll tell you very specifically that they are extraordinarily worried about the over-leverage of the Australian population in general," he said. He flagged how exposed the country's lenders were to a correction.

"If they get a property downturn anything similar to 1989 to 1991 then they are going to have all sorts of issues," Parker said.

Last Week's Gold "Fatfinger" trade was an Options Expiry Spoof

$
0
0

You Know What to Do

  • The Gold Wave Count Still points upwards, but external signs make us nervous
  • New info tells us the Flashcrash  last week was most likely an options related price manipulation
  • There is a new class  action  lawsuit worth watching as it crosses international  borders.

So far the charts and wave count are all holding. We must admit that the double bottom at $1241 being broken gave us quite a scare. And we stick to the "triple bottoms are made to be broken" axiom. Bullish bias aside, if we dip below $1241 again, we think  $1220  won't be a problem. Even then, as freaked out as it would seem, the market is still ok for its next run higher by many measures. 

The Bull Case Reiterated

Authored by Soren K. Group for Marketslant

By combining Elliot Wave and traditional Technical Analysis we have been fortunate to be on  the right side of this move  that started  around $1214. But it is getting hairy now. Breaking $1247 took out a leg despite the fact we are back above  it. Taking out $1241 was another area we liked. Being above it again is obviously good. but it would be much better if we saw some people "get short in the hole". Unfortunately we did not see shorts getting in net-net, but longs getting out. So on balance the analysis is still valid, but we are on alert that the  next dip may not be bought at all. In Resistance/ Support Terms it reads like this

  • 1550
  • 1350
  • 1296
  • 1280
  • 1257-1259
  • 1247- 1248
  • 1241-1238
  • 1217-1214
  • 1150

Numbers aggregated from these Posts 

  1. MYSTERY SOLVED? GOLD OVER $1214 GIVES $1550 AS TARGET
  2. Project $1550 Gold: Buy Dips Above $1248
  3. Why Gold is Up and Why $1550 is Still The Target.
  4. Wave Count Hints at $1241 Bottom
  5. Above $1259 Settlement Gets you $1296 

The Knot in Our Gut Just Got Bigger

One of our colleagues came out of hibernation recently  and quite voluntarily voiced something we  were afraid of in these recent swoops and flash  crashes.  Without giving away his system we will just say that with 30 years trading Gold and managing money for some  of the biggest players in Metals during that time, when  he makes a statement, we take note. Quite simply:

$1214 gets you $1200 and if we break that number a freefall should commence leading to $1150

So it is stuff like that that scares  us. What's more his opinion is not based on Elliot Wave counts, but he reads them  nonetheless. He just thinks  that the wave count we are following is not going to hold. 

Gold Today is basically unchanged  


click pic for updated prices?


Gartman  And Goldman are Bullish Now

Do we have to say anymore? It has been our experience that when Goldman is bullish, the next $20 may be higher, but the next $50 is likely lower. As to Gartman, he has a bad rep in predicting Oil prices. Histrack record isnt so bad in metals. We happen to have a good idea why. Gartman is wired to a couple London Bullion dealers and when he gives info or insight, especially in explaining a move, he is very good.

So we are not as negative on Gartman as a "contrary indicator" as most in the trade are. That said, the power of a Goldman  recco buy combined with a Gartman  long idea is like  crossing the streams in  Ghostbusters ( the good one girls)

Finally, and this is purely observing the context of Gartman's statements: Talking about Gold and Bitcoin is like saying "I want some publicity so I'll act like I know my ass  fro m my elbow in  Crypto currencies."

Really, we know a shitload about these products and in some circles are considered experts in the macro concepts governing them.

The only thing we feel we are expert about in Bitcoin and its ilk is in learning everyday we don't know shit about them and got to keep  learning. So who the F&*k is Gartman to even  have an opinion on Bitcoin? He may as  well be talking about Beanie  Babies.

And that is the final straw or us.

Flat is Where It's At

Goldman and Gartman are bullish.  Out gut says the downside is vulnerable, and a seasoned professional who rarely makes statements  is now uber bearish. So what is our conclusion?

Project $1550 is still in play, but we would rather now buy strength  than weakness. Flat is where it is at now with a buy stop entry above $1259 and a sell stop exit below $1240. The first upside target if the wave count holds is $1296. That's our  call. 

And if our bearish colleague is right, sell  the crap out of it below $1241 on a settlement basis.

About the Flash Crash - it was manipulated

We've been very vocal  in stating that a fund puked to a commercial last week causing the $18 swoon. What was interesting was the strong bounce. While we still stick to our info  that the most likely scenario was a fund puking to a commercial there was something that bothered  us about the way it bounced. What kind of idiot would buy back  in like that? And then it hit us. There was an option expiration we believe on the LBMA and it is quite possible a commercial wanted to "make his option position right". And that is what one London trader told us. We already knew that the COMEX expiration  was coming due as well. Odds  are overwhelmingthat COMEXoptiosn positions had offsetting LBMA expiring positions. That is just from our experience.

Our London Source:

Someone wanted to make themselves right at an expiration. The bounce came post expiry, after the risk went away. Possibly a cash settled LBMA look alike vs a Comex futures-settled hedge 

Here is some analysis into how influential an option expiration can be. Even bigger than a daily Fix. It is during  option expirys that the tail wags the dog.

 Viking Analytics agrees and puts it rather eloquently:

The COMEX Gold Options Market is Enormous

The flash crash of gold occurred one day before the COMEX gold market had a key expiration date. The COMEX gold options market is enormous, accounting for approximately 45% of the value of the COMEX gold futures market. While many market analysts pay attention to the gold futures market, it is rare to find an analyst that provides commentary on the options market. [Soren K- we  agree and now number Vokingamong the few that "get it"]

The most recent Commitment of Traders ("COT") report can easily demonstrate the influence of the options market. The delta-weighted options on June 20th were approximately 46% of the futures open interest. The "delta-weighted options" essentially means the "equivalent futures contracts."

The main point that we are trying to make here is that the COMEX gold options market is enormous and influential, every bit as influential as the futures market itself.

The Value of Options in the COMEX Gold Market and GLD

Not only is the COMEX options market significant, the options market in the SPDR Gold Trust (GLD) is significant as well.

At Viking Analytics, we have created a (beta version) program to calculate the value of every call and put option at the end of every COMEX trading day. We also calculate the value of certain relevant call and put options for GLD. At the end of the day on June 23rd, the value of all call and put options that expire in June was $66.7 million.

Moreover, the value of the options that expire Tuesday on the COMEX were $28 million and $24.5 million for the calls and puts, respectively as of June 23rd.

Moreover, the change in value of the aggregate calls and puts expiring June 27th might be as much as 50% of the value of the calls and puts themselves.

Therefore, there is a lot of money riding on the closing price Tuesday at COMEX  [Soren K.- and look alike LBMA] options expiration.

This explains much more cleanly why a commercial sold volume and then the market bounced the next day. We have one source saying this was a factor now and have adjusted our opinions accordingly. We will not look for others because it doesn't really matter does it? it is a market reality that must be traded around. Gold is manipulated and the depth of that manipulation is so large that no court will be able to understand just how much  money is stolen with: spoofs, fat fingers, pinned option expirations, fixes, slams, swoops, and the usual front running. And we have seen this first hand as victims in options in  every commodity traded.

So whether a fund puked or an option expired, there was some manipulation going on. We already know the truth. The problem is in finding facts. By the time investigators see the fire investors have already choked on the smoke.

Some Flash Facts:

  1. The contracts traded the minute of 4:01am were MORE contracts traded than any other minute of the trading day Monday. The trading range in the 4:01am EST minute was about $18 per ounce.
  2. The second panel in Eric's chart above shows a dynamic bid-ask "stack" with the at-the-market bids in dark blue, and out-of-market bids in red. The main point here is that the flash sale of 2% of annual mining supply completely removed liquidity from the futures market. The order to sell 1.8 million ounces hit many of the bids that were offered at 4:01am. This is perfectly legal. However, it shows the power of some market participants (who have the capital to do so) to dramatically change market dynamics in a single (illiquid) minute.


The Game is rigged. And even  with the new UK lawsuit gathering steam we do not believe the actual money stolen from  investors numbers can ever be known. But we arepretty sure that whatever is offeredby these  lying settlers, it is 10x that amount. But we gotta keep trying

Click for info


Bob Rodriguez: "We Are Witnessing The Development Of A Perfect Storm"

$
0
0

Authored by Robert Huebscher via AdvisorPerspectives.com,

Robert L. Rodriguez was the former portfolio manager of the small/mid-cap absolute-value strategy (including FPA Capital Fund, Inc.) and the absolute-fixed-income strategy (including FPA New Income, Inc.) and a former managing partner at FPA, a Los Angeles-based asset manager. He retired at the end of 2016, following more than 33 years of service.


He won many awards during his tenure. He was the only fund manager in the United States to win the Morningstar Manager of the Year award for both an equity and a fixed income fund and is tied with one other portfolio manager as having won the most awards. In 1994 Bob won for both FPA Capital and FPA New Income, and in 2001 and 2008 for FPA New Income.


The opinions expressed reflect Mr. Rodriguez’ personal views only and not those of FPA.


I spoke with Bob on June 22.

In a recent quarterly market commentary Jeremy Grantham posited that reversion to the mean may not be working as it has in the past. What are your thoughts on mean reversion?

There will be a reversion to the mean. We are in a very difficult and challenging time for active managers, and in particular, value style managers. Many of these managers are fighting for their economic lives.

Given that I am no longer involved professionally in managing money, I believe the standards in the industry are being compromised; monetary policy has so totally distorted the capital markets. You are now into the eighth year of a period that is unprecedented in the likes of human history.

The closest policy period to what we have now would have been between 1942 and 1951, when the Fed and Treasury had an accord to keep interest rates low. Interest rates were artificially held lower to help finance the World War II effort. With the renewal of inflation after the war, a policy war developed between the Treasury and the Fed on the continuation of a low interest rate policy. The Treasury-Fed of 1951 brought this period to a close. But that is the only time we’ve had a period of nine years of manipulated, price-controlled interest rates.

This was a historical policy I discussed with my colleagues upon my return from sabbatical in 2011: what could unfold were controlled, manipulated and distorted pricing that could disrupt the normal functioning of the capital markets. The historical cycles that Jeremy would be referring to that entailed a reversion to the mean could be distorted, for a period of time, by this type of monetary policy action.

But I do not believe the economic laws of gravity have been permanently changed.

At a Grant’s Conference last year Steven Bregman asserted that indexation in general and ETFs in particular were factors in the under-performance of active managers and are potentially a bubble. Are you familiar with his work and what are your thoughts on ETFs? What is driving the flow of mutual fund assets to passive strategies and what can or should fund companies do in the face of this trend?

I go back to a speech I gave in 2009, Reflections and Outrage, and buried within that speech is a section that said that if active managers did not get their act together then the likelihood would be that passive strategies would continue to take market share. When you have a market that is distorted by zero interest rate policy, David Tepper said it very well many years ago, “Well, you’ve got to ride it.”

It’s a rocket ship that’s going up. If you are fully invested in the right areas, you have a shot at out-performing. However, if you are an active manager who has a valuation discipline, given the valuation excesses in the capital markets now and that have been developing for the past several years, then an elevated level of liquidity would be held, if you were allowed to do so. As such, you will likely underperform the market.

Active managers have not demonstrated a value-add to an appreciable extent over the last 20 years. When I look back at what happened prior to 2000, if an active growth stock manager could not see the most extraordinary distortion and elevated, speculative market in history, when will they? In the lead up to the 2007-2009 financial crisis, many value-style managers did not cover themselves in glory either. If you looked at what their major stock ownership concentrations were, they were very much in large banks and various types of financial institutions that were going to get crushed in the credit downturn. If they couldn’t acknowledge or identify the greatest credit excess in history, when will they?

I’m picking on both growth- and value-style managers for missing two of the great bubbles in history. This miss led to capital destruction. Now we have a clueless Fed, in my opinion, that has never known what a bubble is beforehand. It is accentuating one that has been developing as a result of its policy insanity of QE. Markets are going straight up predicated on it.

The public looks at these outcomes and says, “Why should I pay higher fees to managers who can’t outperform or can’t even identify a major speculative blow off. I might as well be fully invested. I might as well be in an ETF or index fund.”

Thus, since 2007, indexing or passive activities have risen from approximately 7% to 9% of total managed assets to almost 40%. As you shift assets from active managers to passive managers, they buy an index. The index is capital weighed, which means more and more money is going into fewer and fewer stocks.

We’ve seen this act before. If you didn’t own the nifty 50 stocks in the early 1970s, you underperformed and, thus, money continued to go into them. If you were a growth stock manager in 1998-1999 and you were not buying “net” stocks, you underperformed and were fired. More and more money went into fewer and fewer stocks. Today you have a similar case with the FANG stocks. More and more money is being deployed into a narrower and narrower area. In each case, this trend did not ended well.

When the markets finally do break, as they always have historically, ETFs and index funds will be destabilizing influences, because fear will enter the marketplace. A higher percentage of assets will be in indexed funds and ETFs. Investors will hit the “sell” button. All you have to ask is two words, “To whom?” To whom do I sell? Index funds and ETFs don’t carry any cash reserves. The active managers have been diminished in size, and most of them aren’t carrying high levels of liquidity for fear of business risk.

We are witnessing the development of a “perfect storm.”

The Wall Street Journal has reported that central banks from Switzerland to South Africa are investing their reserves in equities. How should investors respond to the participation in the price discovery system by players that can print money and may not be performance-driven?

The last thing I ever wanted to do as a professional was allocate capital to areas that government was buying. With governmental-driven decisions there are virtually no penalties for bad decision making. Look at the rank stupidity of Dodd-Frank, or Paulson, Bernanke, and Greenspan. They were clueless before each of the last crises. They helped drive a system off the tracks. What penalty have they paid? None! They get to keep their pensions.

But when you have central banks deploying capital and their cost of money is zero, they destroy the capital-asset pricing mechanism; they destroy comparability; the distortions continue.

As a dedicated contrarian, the last place I want to invest money is where governments are deploying the capital because they are so totally distorting the market.

How did the discipline of value investing as you practiced it at FPA, change over the course of your career, particularly since the financial crisis?

It’s an interesting question and I’ve asked myself that many times.

The markets moved more slowly prior to this century – the ebbs and flows, the decision-making and the conveyance of information. With the advance of electronics and the internet, the speed of dissemination of news accelerated. I don’t believe that judgments have improved; just the speed has accelerated and the time frames of patience have shortened.

I bet my entire business in the spring of 1998 when for the prior 11 or 12 years I ran my mutual fund, the FPA Capital Fund, on fumes, with 1% to 2% cash and sometimes even less than 1%. Had you held liquidity, with short-term bond yields in the high-single to double-digits, you would have underperformed the stock market by anywhere from 900 to 1,100 basis points. By 1998 the consultant’s mantra was to be “fully invested.”

I went out in the spring of 1998 arguing that the equity market was becoming excessively priced, and it continued to do so. I sought permission to move my liquidity limits from 7% to 10% which were the typical maximums, to upward of 30%. I had to fight every client on that. By the spring of 2000, without losing any money and avoiding the carnage, I took a little bit over a 50% reduction in my assets under management. I got fired. In 2007-2009, I did far more preparation and communication prior to that crisis and entered it with 45% cash.

In the first phase of a debacle like what went on in the financial crisis, it doesn’t matter whether you are a virgin or are the opposite. When they raid the entertainment house and you happen to be a person walking by, just out of the church right next door, you get caught with all of the people there.

In the aftermath the police discover, “Oh, you shouldn’t be here.” Well, it’s the same way in a crash; virtually everything gets hit. Then in the second and third stages, the real values start to unfold and you get a greater differentiation. That is what happened with my fund between 2007 and 2009 and subsequently.

A cash level of 45% was a real tough strategy for clients to handle. I had one client say, “Please stay fully invested for my account and just do your thing with the others.” I said, “No, the price you ask me to pay is too high. By being fully invested managing your money, I will contaminate my thinking, which will negatively affect my other clients. I’m sorry, that’s a price too high to pay.” I said, “Where do you want me to return the money?” He said, “Let me think about it.” The next day his response was, “Okay, you’ve got flexibility.” But I still took over a 50% hit in redemptions during that crisis.

Looking back at these two prior major cycles, it is far more difficult for a value manager to hold liquidity today in light of the policies that are being deployed. These are the worst fiscal and monetary policies in human history.

If I were still professionally managing money, despite my background of pain-and-suffering from being redeemed, my liquidity allocation would be north of 60% today.

So-called “smart-beta” products have become very popular, particularly those that incorporate a quantitatively-driven value strategy based on the Fama-French factor models. For investors that want a value-oriented portfolio, what concerns should they have with these strategies?

I have never seen a quantitative strategy succeed longer term. They are predicated on models. The models are predicated on history. When history changes, they have to develop a new factor model.

We witnessed this in the last cycle. There was an article in the WSJ quoting a quant manager who said on a Wednesday, we had experienced a 1-in-10,000 year event. On Thursday, we had a 1-in-10,000 year event. On Friday we had a 1-in-10,000 year event. A former colleague wrote an email that weekend that said, “I have a quick question to ask. On Monday, are we safe for the next 30,000 years?”

All of these strategies are meant to enhance or give an essence of how you are going to try and minimize risk and enhance return. When you are in an environment where the lead entity, the Federal Reserve, has its foot on the scale and is distorting the information coming out of the capital markets, where interest rates can go to zero, what is the proper hurdle rate for budgetary or capital allocation decisions? These actions distort the price comparison or discovery process in the capital asset-pricing model. This is highly disturbing.

By the way, I wrote a piece in 2008 before the Fed even knew they were going to balloon their balance sheet. It said they would have to increase the balance sheet by at least a trillion to a trillion and a half. They hadn’t got to that realization yet.

After 45 years of watching the Fed, the only Fed chairman that was worth spit was Paul Volcker. The last great central banker that we had in the last 110 years other than Volcker was J.P. Morgan. The difference is, when Morgan tried to contain the 1907 crisis, he wasn’t using zeros and ones of imaginary computer money; he was using his own capital. As long as you have anointed centralized bureaucratic decision makers like the Federal Reserve, that in many ways is similar to the concentrated decision making structure of the former Soviet Union, decisions will be late and generally wrong. The Fed is a large organization and like all large organizations, there are internal pressures where they try to come to a consensus, and so they do.

This is not how you make your greatest decisions.

If there is one piece of investment advice you would offer to a young professional embarking on a career now, what would that be?

I will give the same advice that I got when I was a very young professional back in 1973. I was two years into the field and a gentleman spoke before my investment class. After everybody had walked out, I walked up to Mr. Munger and I asked him, “Sir, if I could only do one thing that would make myself a better investment professional, what would you recommend?” He responded, “Read history, read history, read history.” I have done that over the years. Had you read about the banking crisis of 1907 and what preceded it in the 1890s, you would have recognized it in a form in 2007.

If there is one piece of management advice that you could offer to that same person, what would that the?

You must have two things – discipline and integrity. Compromise either and you will fail.

That’s true in all walks of life.

Yes, but it’s very easy to use the justification that this time is different.

The world has changed. I gave a speech in 2001 to some pension advisors. I said, “Look at you people out there.” I hadn’t shown them my chart yet but I said, “Look at what we have just gone through. We had the greatest, the highest level of computerization in the history of man, the most timely acquisition to information, the highest percentage of advanced degreed professionals and college graduates in the field, and we got an outcome no different than 1974, 1929, 1907. There is something more here going on.”

Then I held up two hand-written stick figures – I was not a good artist. They were cows and they were talking to one another. One cow said to the other, “Glad we’re not part of the herd.” The other cow said, “Yea.” The next exhibit was an aerial shot. It showed the two cows are in a ravine, so they can only see themselves. But all around them is the herd. I looked out and said, “People, whether you realize it or not, you are part of the herd. All you have to understand is one word, now let’s say it all together. Moo.” What a way to influence friends and make new clients.

How are you investing your personal assets?

I am at my lowest exposure to equities since 1971. They represent less than a fraction of one percent. Liquidity is north of 65%, all in Treasury-type securities, nothing beyond a three-year term. I do not trust what is going on fiscally or monetarily, and I’ll circle back on this in a moment. The balance is in rare fully paid-for physical assets.

Circling back, after I stepped down from daily money management at the end of 2009, I took a sabbatical. One of my goals was to meet a gentleman by the name of David Walker, the former comptroller general of the U.S. He wrote a book called Comeback America that I read in January of 2010. I sent my review to Dave. Two days later Dave called me and said, “My name is Dave Walker. Is this Bob Rodriguez? If so, I want to thank you for your review.” That’s how we came to know one another. I’d used his work for over 10 years. For the next three and a half years I was a sponsor of his program, Comeback America. He closed it down in 2013, a complete unmitigated failure.

Think about the budgetary battles of 2011; the only thing that was cut was defense. Two thirds of the expenditure cuts that were going to get controlled under the system would not occur until after 2016. Funny how that works. In the presidential debates, only one candidate used a word that I think has now left the English language, “sequester.” That was Bush and it was to eliminate sequestration to raise defense spending.

The 2016 election was one of the most important elections in the last 80 years. Back in 2009 I said if we do not get our economic house in order sometime between 2014 and 2018, we could see a crisis of equal or greater magnitude than the 2007-2009 crisis. I also argued that we would have a substandard recovery that would be no better than 2% real GDP growth for as far as the eye can see. Productivity and capital spending would be substandard. All of those have played out.

Here we are in 2017. I have seen absolutely nothing that would give me any degree of confidence that Washington will get its act together. We are into a period of expanding deficits. We are hitting a time where the entitlements are worsening in terms of their funding status. We are in a decade that is unprecedented from anything that we’ve seen before with monetary policy and fiscal policy.

Why on Earth should I allocate capital into a system where the scales are completely manipulated, price discovery is distorted, and the Fed doesn’t have a clue what’s going on? They’ve missed every economic forecast for the last nine years straight. Why would anybody pay any attention to what those people are doing?

I have confidence in one thing. The Fed will blow it.

My thoughts are very much analogous to those of Lacy Hunt. Where Lacy and I part company is what happens after the deformation hits. He would argue that we will be in a dis- or deflationary period for an extended period of time; therefore, you should own 30- and 20-year Treasury bonds.

I’m not so sure about that scenario. It occurred in Japan because it has a very cohesive society. That is not the case in the United States or in Europe. Our patience will be far shorter. At some point, in no more than one to two years, the Fed would likely panic and panic big time, and we will see QE on steroids. We will see monetary inflation. Lacy and I have a similar view. But the really big question is what the outcomes will be on the other side of this mess. Both of us could be very right, or very wrong, or partially in between.

I am managing my estate in a hedged fashion because what we are going through is without any precedent in human history. How can anybody have confidence that their particular view is the right view?


"It's Too Late" - 7 Signs Australia Can't Avoid Economic Apocalypse

$
0
0

Authored by Joe Hildebrand and John Adams via News.com.au,

AUSTRALIA has missed its chance to avoid a potential “economic apocalypse”, according to a former government guru who says that despite his warnings there are seven new signs we are too late to act.

The former economics and policy adviser has identified seven ominous indicators that a possible global crash is approaching — including a surge in crypto-currencies such as Bitcoin — and the window for government action is now closed.

John Adams, a former economics and policy adviser to Senator Arthur Sinodinos and management consultant to a big four accounting firm, told news.com.au in February he had identified seven signs of economic Armageddon.

He had then urged the Reserve Bank to take pre-emptive action by raising interest rates to prevent Australia’s expanding household debt bubble from exploding and called on the government to rein in welfare payments and tax breaks such as negative gearing.

Adams says he has for years been publicly and privately urging his erstwhile colleagues in the Coalition to take action but that since nothing has been done, the window has now closed and Australia is completely at the mercy of international forces.

“As early as 2012, I have been publicly and privately advocating that Australian policy makers take pre-emptive policy action to deal with the structural imbalances within the Australian economy, especially Australia’s household debt bubble which in proportional terms is larger than the household debt bubbles of the 1880s or 1920s, the periods which preceded the two depressions experienced in Australian history,” he told news.com.au this week.


“Unfortunately, the window for taking pre-emptive action with an orderly unwinding of structural macroeconomic imbalances has now closed.”

Former Coalition economic adviser John Adams.

Former Coalition economic adviser John Adams.Source:The Daily Telegraph

Adams has now turned on his former party and says both its most recent prime ministers have led Australia into a potential “economic apocalypse” and Treasurer Scott Morrison is wrong that we are heading for a “soft landing”.

“The policy approach by the Abbott and Turnbull Governments as well as the Reserve Bank of Australia and the Australian Prudential Regulation Authority, which has been to reduce systemic financial risk through new macro-prudential controls, has been wholly inadequate,” he says.


“I do not share the Federal Treasurer’s assessment that the economy and the housing market are headed for a soft landing. Data released by the RBA this week shows that the structural imbalances in the economy are actually becoming worse with household debt as a proportion of disposable income hitting a new record of 190.4 per cent.


“Because of the failure of Australia’s political elites and the policy establishment, the probability of a disorderly unwinding, particularly of Australia’s household and foreign debt bubbles, have dramatically increased over the past six months and will continue to increase as global economic and financial instability increases.


“Millions of ordinary, financially unprepared, Australians are now at the mercy of the international markets and foreign policy makers. Australian history contains several examples of where similar pre conditions have resulted in an economic apocalypse, resulting in a significant proportion of the Australian people being left economically destitute.”

Following his landmark seven signs of the economic apocalypse, which was read by a quarter of a million people, Adams has now identified seven signs that it is too late for Australia to take action. Here they are in his own words:

SIGN 1: TIGHTENING MONETARY POLICY

The US Federal Reserve has raised interest rates. Picture: Andrew Caballero-Reynolds

The US Federal Reserve has raised interest rates. Picture: Andrew Caballero-ReynoldsSource:AFP

A cycle of global monetary tightening has begun. For example, the US Federal Reserve has raised short term interest rates in December 2016, March and June 2017 with more forecasted increases to come. The US Federal Reserve also announced a program, expected to commence within months, which would shrink its balance sheet (i.e. quantitative tightening) by selling its holdings of $US6 billion a month from Treasuries and $US4 billion a month from mortgage bonds, increasing each quarter until the Fed’s balance sheet is being reduced by a total of $US50 billion a month or $US600 billion per year.

Market expectations are now being set by officials at the Bank of Canada and the Bank of England for higher interest rates in both Canada and the UK in the near future.

Due to Australia’s record high foreign debt, increases in the international cost of credit are being passed onto Australian borrowers through the banking system, particularly on interest-only and investor loans.

SIGN 2: INVERTED AND FLATTENING YIELD CURVES

Chinese officials kick off trading on the long awaited Bond Connect link. Picture: Vincent Yu

Chinese officials kick off trading on the long awaited Bond Connect link. Picture: Vincent YuSource:AP

In May 2017, the Chinese Government bond market recorded its first ever inverted yield curve. Also, the US Government bond yield curve, over the past 6 months, has significantly flattened as some market analysts anticipate an inverted US yield curve in late 2017.

Inverted yield curves (or where long-term debt instruments have a lower yield than short-term debt instruments of the same credit quality) are known as a market predictor of a coming market crash or broader economic recession.

SIGN 3: SOVEREIGN AND CORPORATE DEFAULTS

Corporate defaults are emerging around the world. Picture: Bryan R. Smith

Corporate defaults are emerging around the world. Picture: Bryan R. SmithSource:AFP

Sovereign government and corporate defaults in both developed and developing economies are beginning to emerge. For example, China has registered in 2017 its highest level of corporate defaults in the first quarter of a calendar year on record. Delinquencies and charge-offs in the United States soared to $US1.4 billion in the first quarter of 2017, the highest recorded level since the first quarter of 2011.

Also, in May 2017, creditors to the International Bank of Azerbaijan (Azerbaijan’s biggest bank) were forced to take a 20 per cent haircut (i.e. a partial default) which was upheld in June by a US Bankruptcy court in New York.

SIGN 4: FALLING CONFIDENCE AND CREDIT DOWNGRADES

In May 2017, six major Canadian banks were downgraded by Moody’s Investor Service (Moody’s) as concerns rise over soaring Canadian household debt and house prices leave lenders more vulnerable to losses. Moody’s also downgraded China’s sovereign debt in May 2017 for the first time since 1989 and has warned of further downgrades if further reforms are not enacted.

In May 2017, S&P has downgraded 23 small-to-medium Australian financial institutions as the risk of falling property prices increases and potential financial losses start to increase. In June 2017, Moody’s downgraded 12 Australian banks, including Australia’s four major banks.

Standard and Poor’s and Moody’s downgraded bonds for the US State of Illinois down to one notch above junk bond status as the state has over $US 14.5b in unpaid bills. Despite a new budget deal passing the Illinois state legislature which raises more revenue through higher taxes, Moody’s this week has placed the state government’s bonds under review for possible downgrade.

SIGN 5: EMERGING CHINESE CREDIT CRISIS

There could be big trouble in big China. Picture: Keith Tsuji

There could be big trouble in big China. Picture: Keith TsujiSource:Getty Images

Significant concerns among international observers are now being discussed publicly regarding the $US4 trillion Chinese Wealth Management Product (WMP) market as Chinese bank regulators are now taking significant interventionist steps to drain liquidity and reduce financial risk. As a result of recent interventionist steps, the one-year Shanghai Interbank Offered Rate hit a two year high at 4.30% in May 2017.

The Chinese WMP market has, in the past few years, experienced significant growth involving long term asset acquisition funded through the use of short term liabilities. Evidence is emerging that the long-term assets within WMPs are not performing consistent with expectations resulting in difficulties meeting short term debt obligations.

The WMP market represents approximately 10% of the Chinese banking system whereas the 2006 07 subprime mortgage backed securities crisis only represented 2% of the US banking system.

SIGN 6: SIGNIFICANT GROWTH IN VALUE OF CRYPTO CURRENCIES

Bitcoin is on the rise, which is not comforting news. Picture: Roslan Rahman

Bitcoin is on the rise, which is not comforting news. Picture: Roslan RahmanSource:AFP

In the past five months, the crypto currencies industry (especially the leading five internationally recognised cryptocurrencies) have experienced tremendous growth in market capitalisation indicating that investors are seeking to escape the formal banking and financial system as well as government mandated fiat currencies.

This is particularly acute in Japan where Japanese businesses and citizens have been pouring into Bitcoin given the Bank of Japan’s unconventional monetary policy measures, such as negative interest rates, as well as that Bitcoin has become legal tender in Japan in April 2017.

For example, Bitcoin has experienced growth in market capitalisation by approximately 170% in the past 4 months, while Ethereum has grown by an approximate 2504%, Ripple by an approximate 4025%, NEM by an approximate 3194% and Litecoin by 1236%.

SIGN 7: DISCREDITED AUSTRALIAN FISCAL AND MONETARY POLICY

Australian policy makers have failed to address economic imbalances. Picture: Stefan Postles

Australian policy makers have failed to address economic imbalances. Picture: Stefan PostlesSource:Getty Images

The 2017-18 Turnbull Government Budget, as well as recent decisions by the Reserve Bank of Australia (RBA) and the Australian Prudential Regulation Authority (APRA), have failed to address the structural imbalances and impediments plaguing the Australian economy.

For example, many of the assumptions underpinning the Turnbull Government’s 2017-18 Budget, including assumptions relating to growth in real Gross Domestic Product, non-mining investment, wages and household consumption, are highly questionable and almost certain not to eventuate, placing significant risk that the Federal Government will not deliver a budget surplus in FY2020-21 as currently projected.

Moreover, despite the introduction of new macro prudential rules by APRA, artificially low interest rates by RBA driven by a flawed monetary policy framework, has seen Australian household debt as a proportion of disposable income continue to climb to a new record high and now stands at 190.4%.

*  *  *

Adams' comments confirm the grave fears of Philip Parker, who serves as Altair's chairman and chief investment officer, who just returned hundreds of millions of dollar of his fund's money to clients...

"...this is not a winding up of Altair, but a decision to hand back client monies out of equities which I deem to be far too risky at this point."


"We think that there is too much risk in this market at the moment, we think it's crazy," Parker said with a candidness few of his colleagues are capable of, at least when still managing money.


"Valuations are stretched, property is massively overstretched and most of the companies that we follow are at our one-year rolling returns targets – and that's after we've ticked them up over the past year. Now we are asking 'is there any more juice in these companies valuations?' and the answer is stridently, and with very few exceptions, 'no there isn't'."


"Let me tell you I've never been more certain of anything in my life," Parker said. "I am absolutely certain we are in a bubble in this property market. Mortgage fraud is endemic, it's systemic, it's just terrible what's going on. When you've got 30-year-olds, who have never seen a property downturn before, borrowing up to 80 per cent to buy three and four apartments, it's a bubble."


In a rather dire forecast, Parker outlined a situation where the stock market could fall as low as 5200 points in the coming months, depending on the confluence of his identified risk factors.


"Australia hasn't had its GFC event, we've been living in this fool's paradise. But if China slows down the way the guys think it will towards the end of this year, then that's 70 per cent of our exports [affected]. You can see already that the commodity market is turning down."


Some speculated whether there is another motive behind the sudden shuttering, but Parker stridently denied any suggestion that there were other factors at play other than a pure investment decision. No personal issues, no position that has blown up and forced his hand. "No, God no," he said. "We've sold out all of our positions at huge profits for our clients."


Bezos Vs Putin - Who Will Be The First Trillionaire?

$
0
0

Authored by James Durso via TheHill.com,

Amazon founder Jeff Bezos is the one of the world’s richest men, and he may become the first trillionaire. But some think Russian President Vladimir Putin’s alleged $200 billion fortune surpasses Bezos’ paltry $90 billion. Who is really #1?

It depends how you count.

First, the numbers are dodgy.

Putin critic Bill Browder, once Russia’s largest foreign investor, says Putin has a $200 billion fortune (compared to Russia’s $1.6 trillion GDP). Browder was ejected from Russia in 2005 after being designated a "threat to national security" and said of his activism, “I was not going after his [Putin’s] enemies, I was going after his [Putin’s] own financial interests.”

He hasn’t produced any proof of the $200 billion other than his “belief,” but his humiliating ejection from Russia and the death in prison of hi­s lawyer, Sergei Magnitsky, might be related.

Second, no one manages $200 billion by themselves. If Putin “had” $200 billion he would demand it be managed well, and that means managed as a portfolio. A portfolio similar in size to Putin’s is Warren Buffet’s Berkshire Hathaway with a total equity of $283 billion. What do you do with $283 billion? You buy things like a railroad or large, visible positions in the airline sector. (And after all that, Buffet still has $100 billion in cash left over.) Managing all that money requires lawyers and financial specialists who are world-class at managing money and keeping their mouths shut. Forever.

The claim that Putin is richest man in the world rests on the assumption that he has front men managing his money. How easy is to do that and not be noticed? Well, for comparison, Prince Alwaleed Bin Talal Alsaud of Saudi Arabia is worth $17.8 billion. But according to The Economist, “his sums don’t add up,” in part because he could be fronting for others members of the Saudi royal family. We can infer from this that Putin would need a herd of billionaires to do his bidding as his alleged fortune is almost 12 times larger than Alwaleed’s, while he has managed to maintain more secrecy than any Saudi royal.

You have to go back in Russian history to know how Putin manages his assets.

Back one hundred years in fact, to the reign of Czar Nicholas II when the wealth of the Romanovs was estimated to be $45 billion (in 1917 dollars) and it was “impossible to separate Czar Nicholas II's wealth from the state's.” Putin probably has a few billion somewhere just to oil the wheels, but who needs bank accounts when the assets of the state are yours?

Like all politicians, Putin probably considers himself immortal. But he also probably remembers what happened to the families of Soviet officials who were purged: if they were lucky they survived their sentence to the Gulag. Which brings us to Putin’s friends and their children, the Kremlin juniors.

Putin’s closest friends from St. Petersburg, such as Gennady Timchenko and Yuri Kovalchuk, the largest shareholder in Bank Rossiya, are reputed to be some of the sources of Putin’s wealth. As such, they were sanctioned by the U.S. in the wake of Russia’s seizure of Crimea but will likely stand firm because they believe in Putin and they know what happened to those in the first generation of oligarchs who wavered.

Nikolai Shamalov is a Putin friend and co-founder with Putin and others of The Ozero (Lake) Cooperative, a development near St. Petersburg. (As Putin friends go, you don’t get closer than an Ozero owner.) His two sons, Yury and Kiril, went on to important positions in state-influenced companies, and Kiril married Putin’s daughter Katerina at a resort owned by Yuri Kovalchuk. The couple is reportedly worth $2 billion.

Russia’s first post-Soviet ruling class may expire peacefully with substantial assets in the hands of their children. Do they have more money than Bezos? It’s hard to tell, but it doesn’t matter if you have the power.

As he shuffles off this mortal coil, the unrepentant Chekist will smile knowing he beat them all.


Steve Cohen Loses His Top Trader

$
0
0

Steven Cohen's veteran top trader is leaving, just months before the formerly-barred hedge fund manager is expected to resume managing outside investor money.

As the NYT's Matt Goldstein reports, Phil Villhauer, 52, who started working for Cohen's then-SAC Capital in 2002, was promoted to global head of trading at the successor company, Point72, shortly after Cohen was forced to stop accepting outside investors’ money as part of an insider trading settlement with federal authorities, converting his hedge fund into an $11 billion family office.

“For 15 years, Phil Villhauer has been an integral member of the firm’s family,” Mr. Cohen and Point72’s president wrote Tuesday in an internal email that was reviewed by The New York Times. “We are sad to let you know that he is retiring from Point72.”

As is well-known, SAC was one of Wall Street’s most successful hedge funds for years, largely as a result of reliance on "expert networks" and "information arbitrage" (a politically correct term) allowing it to charge some of the industry’s highest fees (usually in the 3 and 45 vicinity), managing more than $14 billion in assets, although it subsequently emerged that the reason for SAC's success was insider trading, to which the company pled guilty in 2013, three years after Zero Hedge first made the accusation. The guilty plea required Cohen to stop managing money for outside investors, and the billionaire converted his hedge fund into a family office to trade his personal fortune.

Steve Cohen at work

Cohen was also barred from managing money for outside investors as part of a regulatory settlement with the SEC over a claim he failed to properly supervise employees, but that restriction ends at year’s end, and Cohen is moving toward reopening a hedge fund, having appeared at a recent industry conference and having his representatives reach out to potential outside investors.

As for Cohen's top trader, Goldstein writes that despite his crucial role at SAC, Villhauer was little known on Wall Street until he appeared as a witness in the insider trading trial of Mathew Martoma, a former portfolio manager at SAC who was convicted in 2014. Prosecutors said Mr. Martoma’s illegal trades helped SAC avoid losses and generate profits totaling $275 million.

In the trial, prosecutors introduced into evidence several emails from Mr. Villhauer, including one in which he referred to Mr. Cohen as “the big guy.”


Mr. Villhauer testified that Mr. Cohen told him in July 2008 to quickly sell millions of shares that Mr. Martoma had amassed in a drug company and to do it with “limited visibility.” Prosecutors said those trades began after Mr. Martoma and Mr. Cohen had a 20-minute Sunday phone call. The call took place just days after prosecutors said an inside source told Mr. Martoma about problems with a major clinical trial the drug company was involved in.

According to the NYT, the Point72 email advising of Villhauer's departure from Cohen and Doug Haynes, the firm’s president, gave no reason for Villhauer’s retirement from the firm with more than 1,000 employees.

Are Markets Being Driven by Fun-Durr-Mentals?

$
0
0

Authored by Lance Roberts via RealInvestmentAdvice.com,

This past weekend, I discussed how the current rally since the election has been based on “hopes” for tax cuts and tax reforms as there was little evidence currently to suggest it was based on fundamental underpinnings. To wit:

“Do not be mistaken, this ‘rally’ IS all about tax cuts. Despite many who are suggesting this has been a ‘rational rise’ due to strong earnings growth, that is simply not the case as shown below. (I only use ‘reported earnings’ which includes all the ‘bad stuff.’ Any analysis using ‘operating earnings’ is misleading.)”

“Since 2014, the stock market has risen (capital appreciation only) by 35% while reported earnings growth has risen by a whopping 2%. A 2% growth in earnings over the last 3-years hardly justifies a 33% premium over earnings.”

The chart below expands that analysis to include four measures combined: Economic growth, Top-line Sales Growth, Reported Earnings, and Corporate Profits After Tax. While quarterly data is not yet available for the 3rd quarter, officially, what is shown is the market has grown substantially faster than all other measures. Since 2014, the economy has only grown by a little less than 9%, top-line revenues by just 3% along with corporate profits after tax, and reported earnings by just 2%. All of that while asset prices have grown by 29% through Q2.

But despite the data, many on Wall Street are suggesting the recent string of“record highs” is all about improving fundamentals and not about the “Trump agenda.” To wit:

“Charles Schwab executive Jeffrey Kleintop has a message for supporters of President Donald J. Trump who believe his election is behind recent stock market gains: The rally is not about him.


The president’s advocates attribute the upturn to anticipation of Mr. Trump’s efforts to cut taxes, decrease regulation and increase infrastructure spending. Mr. Kleintop doubts that the president’s anticipated policies have been decisive.


‘The Trump rally doesn’t exist, it’s rooted in the fundamentals.’


What’s driving the markets upward are corporate sales growth and first-quarter earnings, both of which have registered their biggest gains in several years.”

Looking at the data above, not so much.

But let’s expand this data even more back to 1955. The chart below is an expansion of the real, inflation-adjusted, profits after-tax versus the cumulative change to the S&P 500. Here is the important point – when markets grow faster than profitability, which it can do for a while, eventually a reversion occurs. This is simply the case that all excesses must eventually be cleared before the next growth cycle can occur. Currently, we are once again trading a fairly substantial premium to corporate profit growth.

Since corporate profit growth is a function of economic growth longer term, we can also see how “expensive” the market is relative to corporate profit growth as a percentage of economic growth. Once again, we find that when the price to profits ratio is trading ABOVE the long-term linear trend, markets have struggled and ultimately experienced a more severe mean reverting event. With the price to profits ratio once again elevated above the long-term trend, there is little to suggest that markets haven’t already priced in a good bit of future economic and profits growth.

While none of this suggests the market will “crash” tomorrow, it is supportive of the idea that future returns will substantially weaker than in recent years.

No, We Aren’t In A New Secular Bull Market

Are we in a strongly trending “cyclical” bull market currently? Absolutely.

Are we in a long-term “secular” bull market as witnessed in the 80-90’s? Absolutely not.

Jeffrey Saut, the chief investment strategist at Raymond James, currently believes the latter. He suggests there may be nearly a decade left in this “secular bull” market, which is defined as a market that’s driven by forces that could be in place for years.

“I say secular bull markets last 16, 17, 18, 19, 20 years. And even if you start the measuring point in March of ’09, you still ought to have another seven, eight, nine years left in this thing. This is going to be the longest, strongest secular bull market of my career and I’ve been in the business 47 years.”

Personally, I hope he’s right as it would sure make my job of managing money easier for my clients.

However, as noted above, and as shown below, “secular bull markets,” which are long-term growth trends, have never started from 15x valuations and immediately surged to the second highest level on record. Historically, as shown below, secular bull markets are born of excessive pessimism and low valuations that stay in place for years as earnings and profitability grow faster than prices (keeping valuations lower.)Despite Mr. Saut’s hopes, that is simply not the case today as valuations exploded as earnings, economic and profit growth lagged the liquidity induced surge in asset prices.

We can see this more clearly by using a 10-year MEDIAN of Shiller’s CAPE ratio. By smoothing out valuation cycles it becomes substantially easier to see that “secular bull markets” have never been born at these levels, but rather died.

Importantly, the drivers behind the long-term secular bull market of the 80’s and 90’s are trends which simply do not exist currently. In the early 80’s and 90’s:

  1. Inflation and interest rates were high and falling which boosted corporate profitability.
  2. The extreme negative sentiment of the late 70’s was finally undone by the early 90’s.  (At the turn of the century roughly 80% of all individual investors in the market began investing after 1990. 80% of that total started after 1995 due to the investing innovations created by the Internet. The majority of these were “boomers.”)
  3. Large foreign net inflows to chase the “tech boom” drove prices to extreme levels.
  4. The mirage of consumer wealth, driven by declining inflation and interest rates and easy access to credit, inflated consumption, corporate profits, and economic growth.
  5. Corporate profits were boosted by deregulation of industries, wage suppression, outsourcing and productivity increases. 
  6. Pension funding requirements and accounting standards were eased which increased corporate profits. 
  7. Stock-based executive compensation was grossly expanded which led to more “accounting gimmickry” to sustain stock price levels.

The dual panel chart below shows the economic fundamentals versus the S&P 500 and the change that occurred beginning in 1983.  (Red dividing line)

Despite much hope that the current breakout of the markets is the beginning of a new secular “bull” market – the economic and fundamental variables suggest otherwise. Valuations and sentiment are at very elevated levels which are the opposite of what has been seen previously. Interest rates, inflation, wages and savings rates are all at historically low levels which are normally seen at the end of secular bull market periods, not the beginning of one.

Lastly, the consumer, the main driver of the economy, will not be able to again become a significantly larger chunk of the economy. With savings low, income growth weak and debt back at record levels, the fundamental capacity to re-leverage to similar extremes is no longer available.

While stock prices have certainly been driven much higher through the Federal Reserve’s ongoing interventions, that support both in the U.S. and Europe is coming to an end. The inability for the economic variables to “replay the tape” of the 80’s and 90’s, increases the potential of a rather nasty mean reversion at some point in the future. It is precisely that reversion that will likely create the “set up” necessary to start the next great secular bull market. However, as was seen at the bottom of the market in 1974, there were few individual investors left to enjoy the beginning of that ride.

Of course, with the virtual entirety of Wall Street being extremely bullish on the markets and economy going into the end of the year, along with bullish sentiment at extremely high levels, it certainly brings to mind Bob Farrell’s Rule #9 which states:

“When all experts agree – something else is bound to happen.”

Viewing all 57 articles
Browse latest View live


<script src="https://jsc.adskeeper.com/r/s/rssing.com.1596347.js" async> </script>